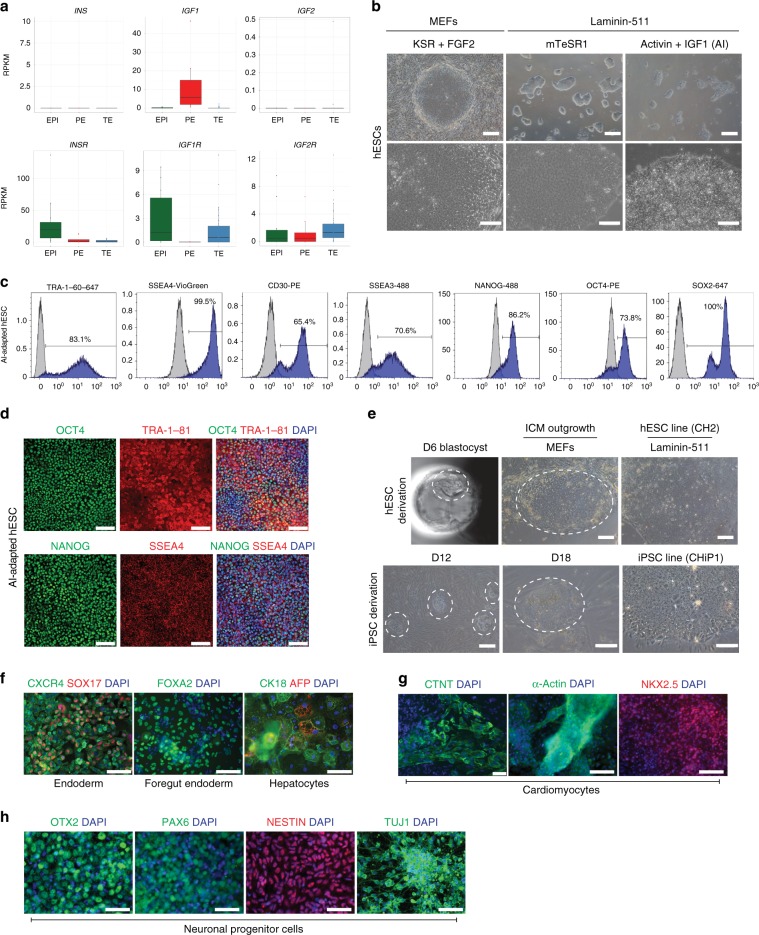
Fig. 1. A chemically defined hESC medium comprising Activin and IGF.
a Boxplots of RPKM values for insulin (INS) and IGF ligands (IGF1, IGF2), and cognate receptors in human blastocyst lineages (EPI green, PE red, TE blue) determined by single-cell RNA-seq10. Boxes symbolise first and third quartiles, horizontal lines the median, whiskers extend to 1.5 times the interquartile range, dots represent outliers. b Representative phase-contrast images of hESCs in KSR + FGF2 on MEFs, or mTeSR1 or AI medium on laminin-511. n = 2 or 3 biological and 3 technical replicates. Scale bar: 300 μm, top row; 200 μm bottom row. c Flow cytometry of AI-adapted Shef6 hESCs for the indicated proteins (blue); isotype control in grey. n = 3 technical replicates. d Representative immunofluorescence of AI-adapted Shef6 hESCs for the indicated proteins; DAPI (blue) nuclear stain. n = 3 biological replicates. Scale bar: 100 μm. e Upper panels: Representative image of a human day 6 blastocyst prior to ICM (circled) dissection and plating in AI medium on MEFs. The resulting ICM outgrowth (circled) was passaged onto laminin-511 to establish a stable hESC cell line (CH2). Scale bar: 150 μm. n = 3 biological replicates. Lower panels: Representative images of iPSCs derived following reprogramming of BJ fibroblasts with Sendai viruses. iPSC-like colonies (circled) could be detected in AI medium within 12 days of induction, and expanded for picking within 18 days to propagate an established iPSC line (CHiP1). n = 2 technical replicates. Scale bars, left to right: 300 μm, 100 μm, 100 μm. f–h Representative immunofluorescence of AI-cultured hESCs following directed differentiation. n = 3 biological replicates. DAPI in blue. f hESCs differentiated towards hepatocyte-like cells first express endoderm markers CXCR4 (green) and SOX17 (red), upregulate FOXA2 (green) as foregut endoderm, then AFP (red) and CK18 (green) as hepatocytes. Scale bar: 100 μm. g Expression of CTNT (green; scale bar 50 μm), α-Actin (green; scale bar 100 μm) and NKX2.5 (red; scale bar 100 μm) following directed differentiation towards cardiomyocyte-like cells. h Expression of neuronal markers OTX2, PAX6, TUJ1 (green) and NESTIN (red) following directed differentiation towards neuronal progenitor cells. Scale bar: 100 μm.

