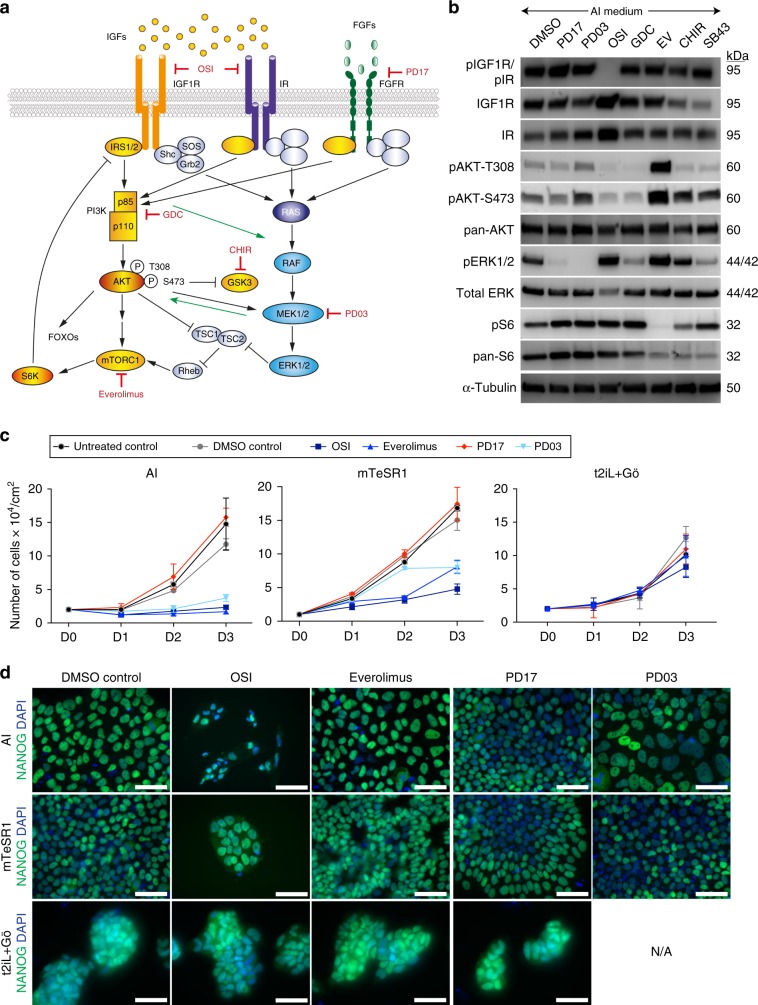
Fig. 3. Insulin/IGF1R/PI3K/mTOR and MAPK/ERK signalling pathways are active in both conventional and naïve hESC culture conditions.
a Schematic of the crosstalk between the insulin/IGF1 and receptor tyrosine kinase (RTK) signalling pathways. Insulin receptor (IR), IGF1 receptor (IFG1R), IGF binding proteins (IGFBPs), receptor tyrosine kinase (RTK), IGFR and IR inhibitor OSI-906 (OSI), FGF receptor tyrosine kinase inhibitor PD173074 (PD17), PI3K inhibitor GDC-0941 (GDC), GSK3β inhibitor CHIR99021 (CHIR), MEK inhibitor PD0325901 (PD13), mTOR1 kinase inhibitor Everolimus (EV). b Representative western blot analysis for proteins related to PI3K/AKT/mTOR and MAPK/ERK signalling in hESCs cultured in AI medium supplemented with DMSO, PD17, PD03, OSI, GDC, EV, CHIR or the Activin/Nodal receptor inhibitor SB-431542 (SB43) for 24 h. n = 3 biological replicates. c Quantification of the total number of viable cells over 3 days in AI, mTeSR1 or t2iL + Gö media supplemented with DMSO, OSI, EV, PD17 or PD03. The value at each time point represents the mean of n = 2 biological and n = 4 technical replicates, and error bars represent s.e.m. d Representative immunofluorescence analysis for NANOG (green) expression in control or inhibitor-treated hESCs in AI, mTeSR1 or t2iL + Gö media, following 3 days of treatment. DAPI (blue) nuclear stain. Scale bar: 50 μm. Source data are provided as a Source Data file.

