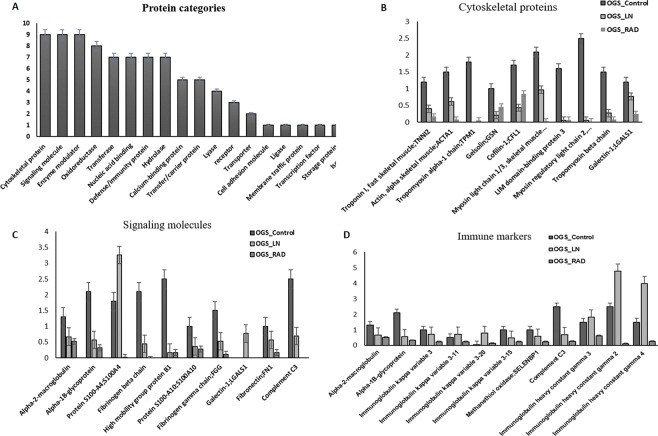
Figure 3.
Differential expressions of the identified proteins between treated (OGS n = 12) and untreated (n = 12) D) were categorized based on the functional enrichment analysis. Sample groups statistics (mean ± s.d) obtained for (A). Various categories of proteins from this study. (B) Altered expressions of cytoskeletal proteins. (C) Differential expressions of signaling molecules. (D) Immune markers expressions in OGS (all categories were quantified among three groups of OGS samples p < 0.01, p < 0.05 one-way ANOVA, Mann-Whitney U-test, triplicate analysis).

