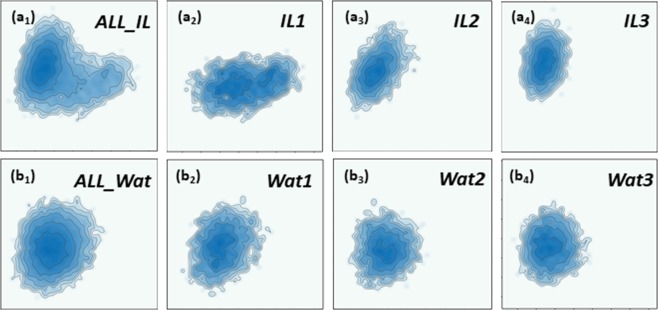
Figure 7.
The contour map generated from our LWPH based PCA models for DNA configurations in IL and WAT environments. The x-axis and y-axis are the first and second principal components. (a1) The DNA configuration ensemble for all three trajectories for IL. (a2–a4) Three DNA configuration trajectories from the MD simulation with IL. (b1) The DNA configuration ensemble for all three trajectories in water environment. (b2–b4) Three DNA configuration trajectories from the MD simulation using water solution. It can be seen clearly that areas of contour map in IL are much smaller than in water, indicating the confinement effect of the DNA configurations in IL. Further, contour graph for IL1 (a2) shows a clear difference of that for IL2 (a3) and IL3 (a4), meaning there is a subtle change of the ion-DNA binding mode in trajectory IL1.

