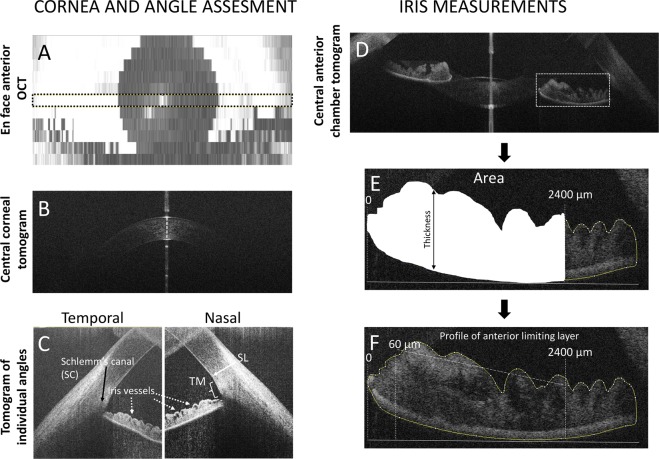
Fig. 1.
Optical coherence tomography (OCT) images of the anterior segment of the eye: a En face image showing the central position of the horizontal scan that was used for AS analysis (between dashed lines); b horizontal tomogram of the central cornea; c nasal and temporal high-resolution tomograms (1200 A scans and 12 B scans) indicating angle landmarks, including Schwalbe line (SL), trabecular meshwork (TM) and Schlemm’s canal (SC); d horizontal tomogram showing temporal and nasal irido-corneal angles; the iris area limited by anterior limiting membrane (ALM) and posterior epithelium (PE) was measured from the pupil to 2400 µm temporally from the pupil; the average iris thickness was measured between ALM and PE (e); standard deviation of the profile of ALM (f) was measured between 60 and 2400 µm temporally from the pupil

