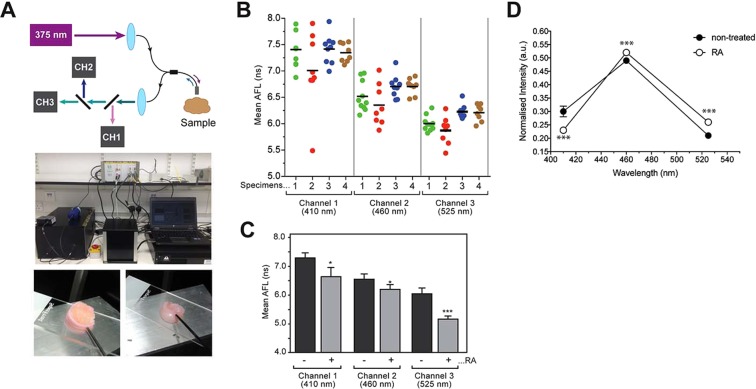
Figure 3.
AFL measurement of human cartilage. (A) At the top, a photograph of the single-point time-resolved spectrofluorometer deployed in this experiment is shown. At the bottom, representative photos of human metatarsophalangeal articular cartilage specimens are shown with the fibre optic point probe in contact with the tissue. (B) Intra- and inter-sample variability of AFL in untreated “normal” specimens. Human metatarsophalangeal articular cartilage specimens were subjected to AFL measurement at different positions in each specimen (6–9 positions/measurements). Different colours identify different specimens. Horizontal bars indicate the average weighted mean fluorescence lifetime over all specimens. (C) Fresh human metatarsophalangeal articular cartilage was treated with or without retinoic acid for 7 days in the culture medium followed by AFL measurement. AFL significantly decreased with retinoic acid treatment. p < 0.0127*, p < 0.0280* and p < 0.0005*** were calculated for channels 1, 2 and 3, respectively (n = 4). (D) Relative contribution of each spectral channel to the overall fluorescence intensity at 375 nm excitation. Each individual point is the average over 4 specimens. The standard deviation was also calculated for each point and its average over all points on the graph is indicated by the error bars on the black circle on the left-hand side. ***p < 0.0005, p < 0.0056 and p < 0.0008 were calculated for channels 1, 2 and 3, respectively (n = 4).

