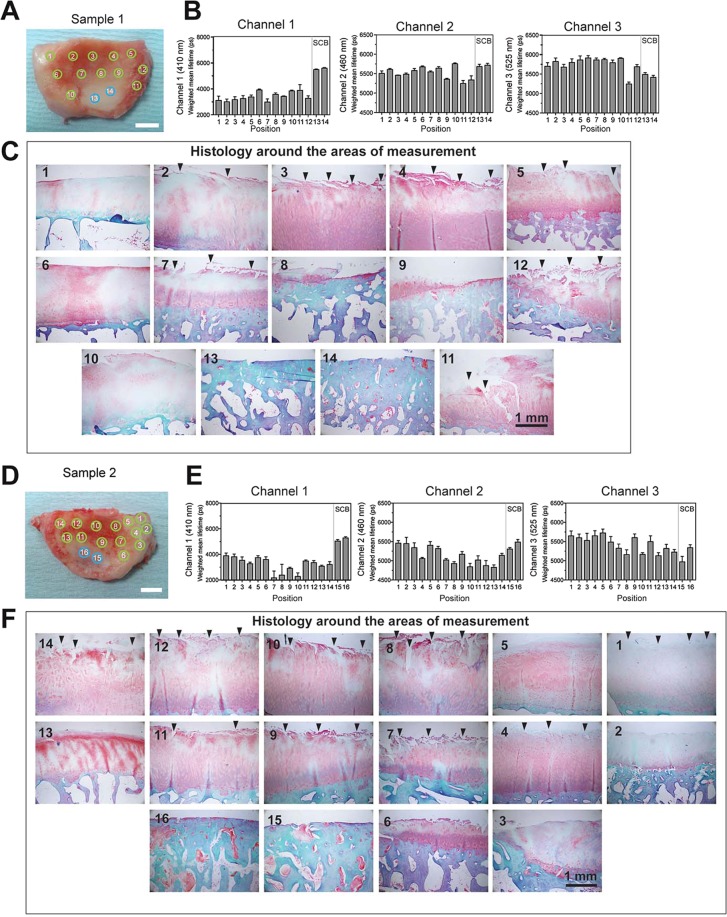
Figure 4.
AFL measurement of human OA cartilage. Analyses from two OA cartilage samples are shown (sample 1 and 2). These OA specimens had a KL grading of IV. Top left image shows photos of sample with the approximate position of the fibre optic probe at the time of measurements, indicated by the green (visibly remaining cartilage) and blue circles (exposed bone). Scale bar 1 cm. AFL results in each spectral channel 1, 2 and 3 are presented below. A total of n = 3 AFL measurements were realized in each position. The tissues were sliced into 9 strips and histological sections were made. Histological images of the closest position from the measurement area of the tissue were shown in the right. Arrowheads indicate tears on the cartilage surface. Scale bar 1 mm. The sections were stained with safranin O and Masson’s trichrome. SCB indicates regions of exposed subchondral bone.

