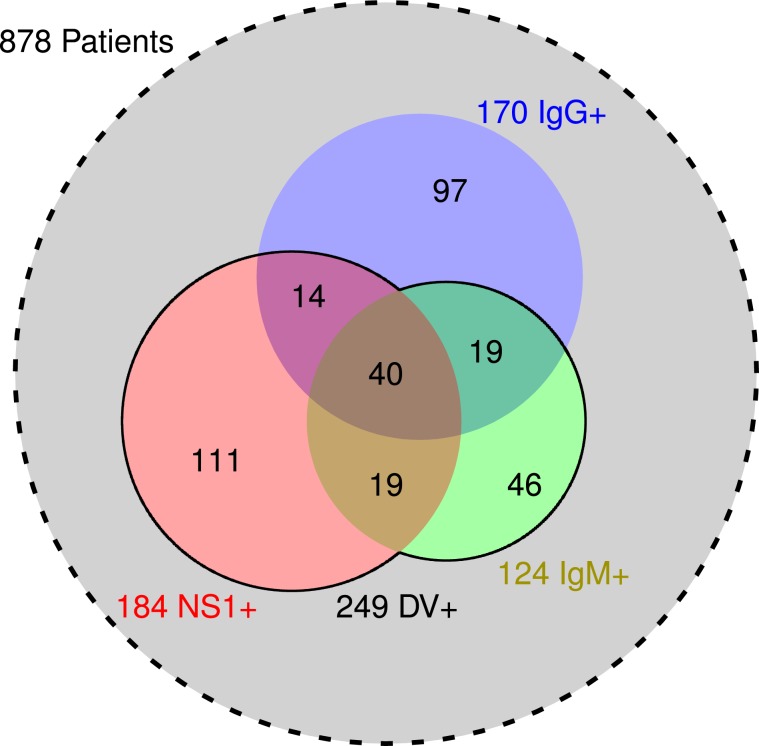
Figure 1.
Serological distribution of the patients. The sets of serum samples positive for nonstructural protein 1 (NS1+, red), immunoglobulin M (IgM+, green) and G (IgG+, blue) are represented by circles whose areas are proportional to the number of patients. The values at the intersections are presented. The solid line represents the set of serum samples positive for dengue (DV+), which is the union of NS1+ and IgM+. The dashed circle in light grey represents all 878 patients.

