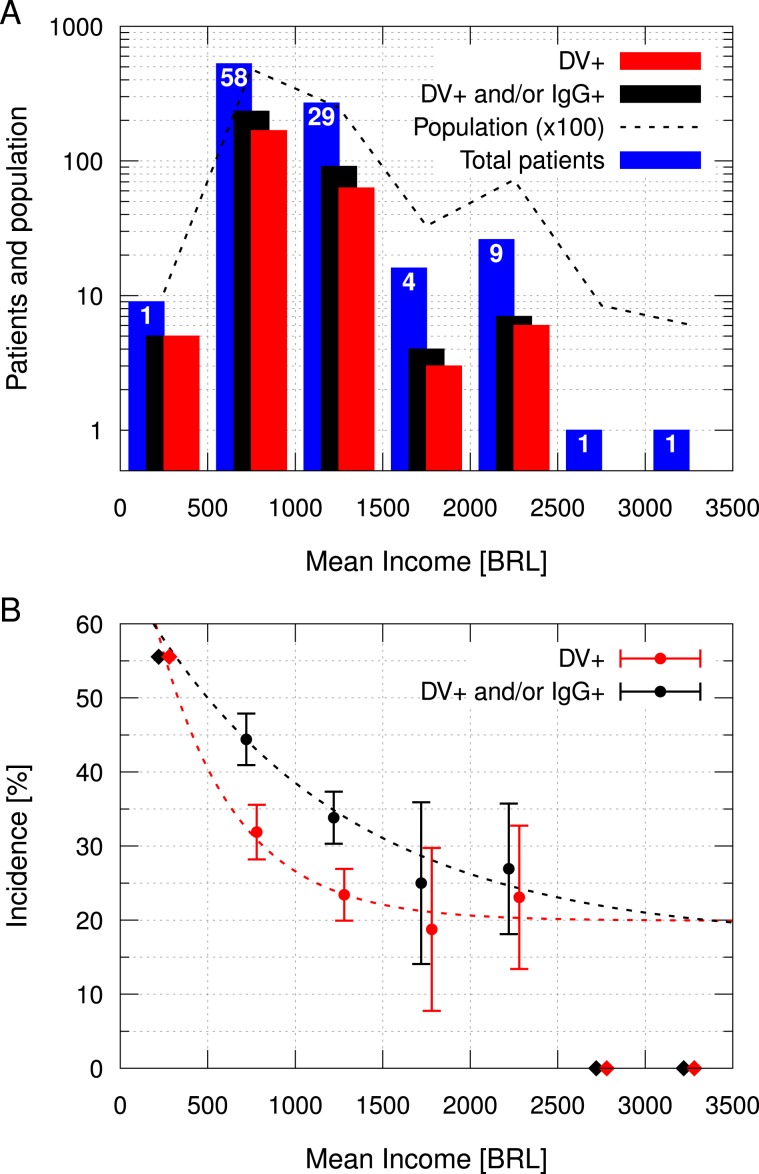
Figure 7.
Distribution of patients and incidence by income, grouped in BRL 500 intervals. Dengue patients (DV+), patients “Not Naïve for Dengue” (DV+ and/or IgG+, NND), total number of patients and number of inhabitants (in hundreds) for each income interval (A). The blue columns represent the number of patients in each interval, while black and red columns represent the NND and DV+ patients, respectively. The dashed line represents the number of inhabitants (in hundreds), and the numbers in the top of the blue columns represent the number of census tracts grouped in each interval. Incidence (cases per total patients) distributed by income (B). The uncertainties refer to the statistical error, calculated using the weighted mean over the census tracts grouped each income interval. There was only one census tract with less than BRL 500, and only two with more than BRL 2500, which were represented by diamonds without uncertainty. Exponential decay fits are represented by dashed lines.

