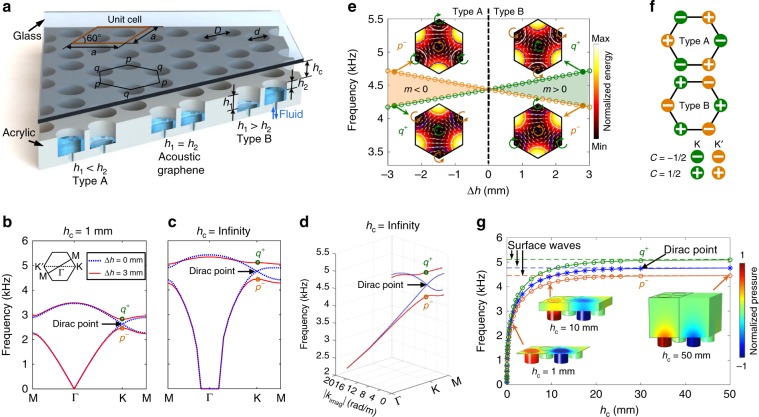
Fig. 1. Schematic of valley topological phononic crystals and their dispersion curves.
a Schematic of the phononic crystals (PCs) composed of a glass ceiling and an acrylic plate with cylindrical cavities distributed in honeycomb lattices. The unit cell (marked by a parallelogram) contains two cavities with the same diameter d. The effective depths h1 and h2 of cavities can be changed by pumping water into the cavities. When h1 = h2, the PCs are considered as an acoustic analogue of graphene. When h1 < h2 and h1 > h2, the configurations are denoted as type A and B PCs, respectively. b Dispersion curves for valley PCs, when the channel height hc is 1 mm. Inset: first Brillouin zone (FBZ). Figure b shows a Dirac degeneracy at the K point, when h1 = h2 = 11.5 mm. A complete band gap is opened, when ∆h = h1 − h2 = 3 mm. c Dispersion curves for valley PCs, when hc = infinity. d Three-dimensional (3D) view of dispersion curves in the complex wavenumber – frequency domain. Figure c can be considered as a projection of the 3D view in the real wavenumber part—frequency domain. e Phase diagram revealed by the order of band-edge frequencies locked with specific vortex features (insets), when hc = 10.5 mm. The color and white arrows in insets indicate acoustic energy and intensities, respectively. The blue and white arcs represent cavities with depths of 10 and 13 mm. Different acoustic insulating phases are characterized by the signs of the effective mass m. f Theoretical valley Chern numbers for type A and B PCs. g Frequency variations of the Dirac, p−, and q+ points with respect to the channel height hc, when the difference ∆h is 3 mm. Insets: pressure fields for the p− mode. The q+ mode’s pressure fields are given in Supplementary Fig. 3. The frequencies gradually increase and approach frequencies for surface acoustic waves (SAWs), as hc increases. The evolutions of pressure fields and waves frequencies reveal the transition from waveguide acoustic waves to SAWs as the channel height increases.

