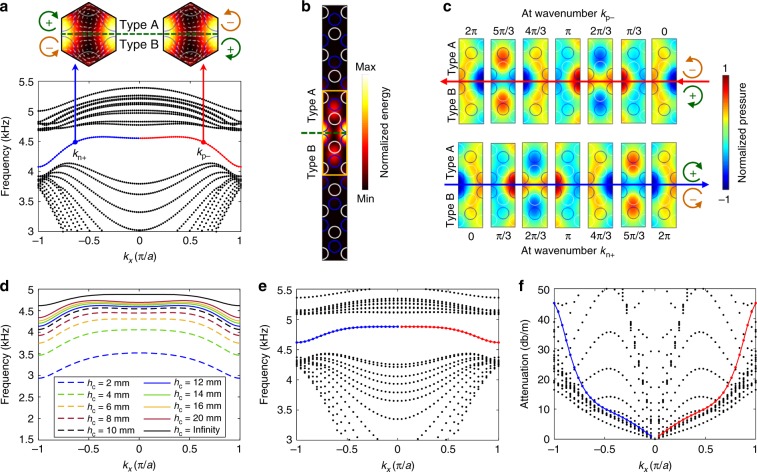
Fig. 2. Acoustic valley Hall edge states and their dispersion curves.
a Dispersion curves for the type A–B supercell, when the channel height is 10 mm and the deep and shallow cavity depths are 10 and 13 mm. The red and blue solid lines are dispersion curves for the edge mode with positive and negative wavenumbers. The black dotted lines are in the bulk bands. Inset: edge states at wavenumbers of kp− and kn+. The color and arrows indicate acoustic energy and intensity, respectively. b Acoustic energy field in a supercell with an A–B interface, when the wavenumber is kp− or kn+. c Evolution of acoustic pressure fields from 0 to 2π in the vicinity of the A–B interface. The top and bottom fields are for kp− and kn+, respectively. The blue and white circles in c represent cavities in with depths of 10 and 13 mm. d Evolution of the edge mode dispersion with respect to channel height hc. With the increase of the channel height, the edge mode frequency for waveguide acoustic waves (WAWs) gradually increases and approaches to that for surface acoustic waves (SAWs). e, f Frequency and attenuation curves for the SAW-type edge mode, when the channel height is infinity. The attenuation is related to the leakage of SAW energy into the semi-infinite air medium above the cavities. The imaginary parts of wavenumbers for the SAW-type edge mode are plot in Supplementary Fig. 13.

