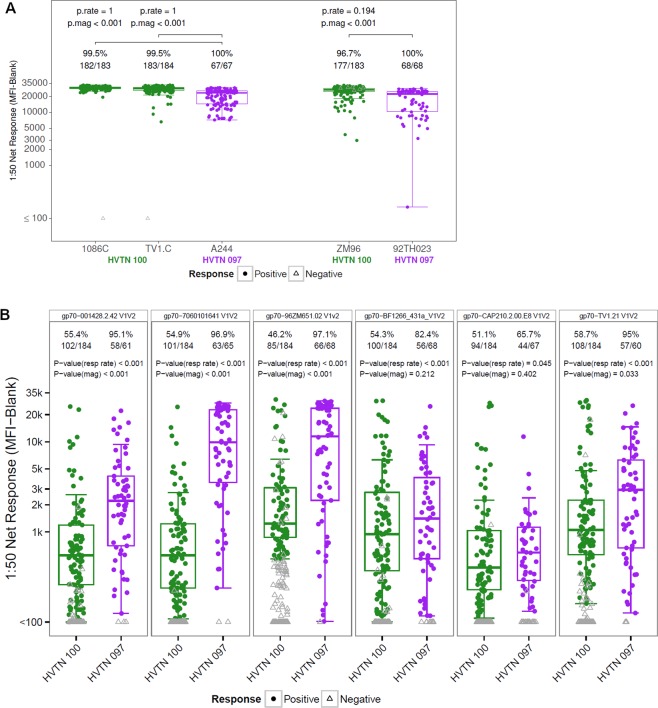
Figure 1.
Higher gp120 and lower V1V2 responses in HVTN 100 compared to HVTN 097. Boxplots for magnitude of binding (based on positive responders only) to vaccine-matched gp120 antigens (A) and a panel of subtype C gp70 V1V2 antigens (B) in HVTN 100 (all available per-protocol participant, N = 185) and HVTN 097 (all available per-protocol participants, N = 73) measured in BAMA. Envelope antigens are indicated on top of each panel. Positive responders are shown as colored circles and negative responders as gray open triangles. Positivity rate and number of responders are listed on top of each box. Unadjusted p values for response rate (p.rate) and magnitude (p.mag) are listed on top of each panel. Data shown here are for a serum dilution of 1:50, which is lower than the 1:200 reported for HVTN 100 previously32 (thus higher antibody concentration) and the same as reported for HVTN 097 previously35.

