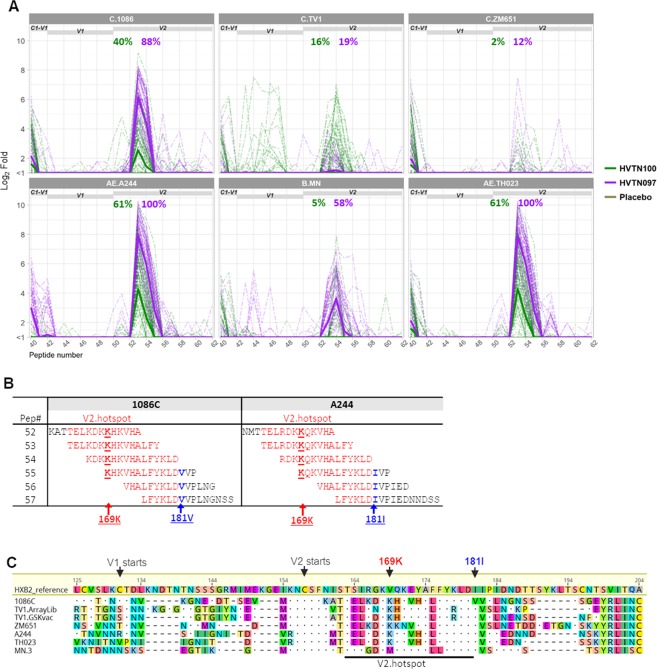
Figure 2.
Higher V2 hotspot linear epitope binding in HVTN 097 compared to HVTN 097. Binding to linear V2 epitopes in HVTN 100 and HVTN 097 at 2 weeks post second protein boost measured by linear epitope mapping. (A) Magnitude of binding (log2 Fold post-/pre-immunization) to overlapping peptides in the V1V2 region of gp120. Thick solid lines represent weighted means (see Statistical Analysis) for all vaccine recipients in each study, and thin dashed lines represent individual vaccinee binding. Listed at the top of each plot are the positivity rates, color-coded for each group as indicated in plot legend, for binding to V2 hotspot. (B) Sequences for the overlapping peptides encompassing V2 hotspot, for C.1086 and AE.A244. (C) Alignment of V1V2 region of sequences for the 6 vaccine strains included in HVTN 100 and HVTN 097, with HXB2 sequence and numbering as reference. Sequences for TV1 included in array library (TV1.ArrayLib) and used as vaccine strain (TV1.GSKvac) are not identical and therefore both are included.

