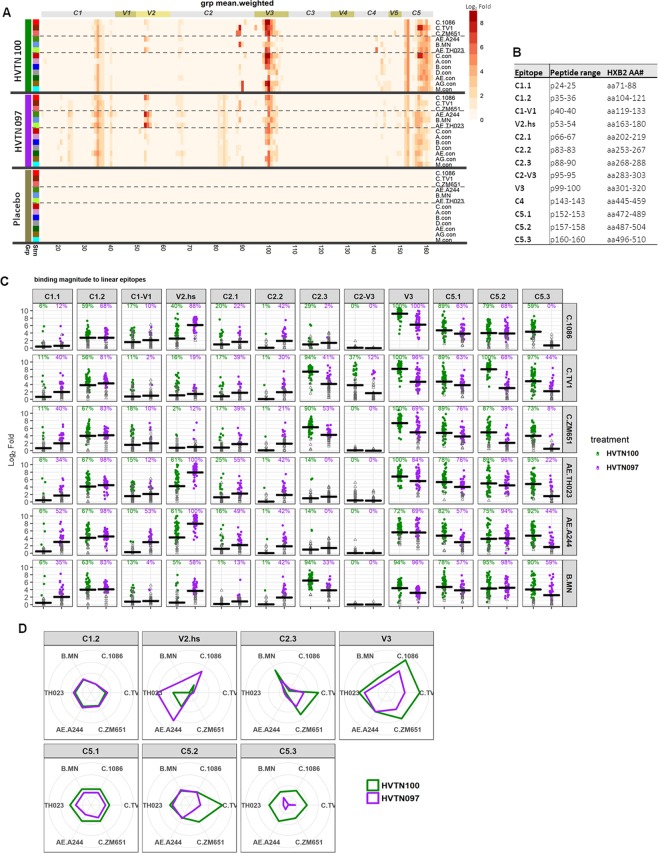
Figure 3.
Different focuses of linear epitope specificity HVTN 100 versus HVTN 097. Linear specificities of antibodies elicited in HVTN 100 and HVTN 097 at 2 weeks post second protein boost characterized by linear epitope mapping. (A) Heatmap with weighted means (see Statistical Analysis) of binding magnitude (log2 fold post-/pre-immunization) comparing HVTN 100, HVTN 097, and placebo measured in linear epitope mapping. The peptide library used in the epitope mapping microarray contains overlapping peptides covering 13 consensus and viral envelope sequences as listed in the plot (also see Methods and Table S2). Thick black lines separate vaccine groups. Each row is for one strain, with dashed lines separating subtype C (top) and subtype B/E (middle) vaccine strains and consensus sequences (bottom). Constant and variable regions are labelled across the top, with the associated peptide number listed along the bottom. Minimum positivity cutoff is 1.58 (Log2 Fold) for individual samples. See Methods for positivity criteria. (B) Definition of linear epitopes identified. (C) Scatterplots for magnitude of binding to each epitope as indicated on top of each column. Magnitude of binding to each epitope is the highest binding magnitude to a single peptide within the epitope region as defined in 3B. Black cross bars represent weighted means (see Statistical Analysis) of all vaccine recipients. Closed circles indicate positive responses and open gray triangles indicate negative responses. Positivity rates (weight-adjusted, see Statistical Analysis) are indicated over the data points and color-coded accordingly. V2.hs- V2.hotspot. (D) Spider plot showing the breadth of binding (in coverage of the 6 vaccine strains) for each major epitope. Major epitope is defined as epitope with positivity rate >75% for any strain in either study. Labeled around each plot are the 6 vaccine strains, from the top clock-wise: C.1086, C.TV1, C.ZM651, AE.A244, AE.92TH023, and B.MN. Values plotted are weighted means (see Statistical Analysis) per study.

