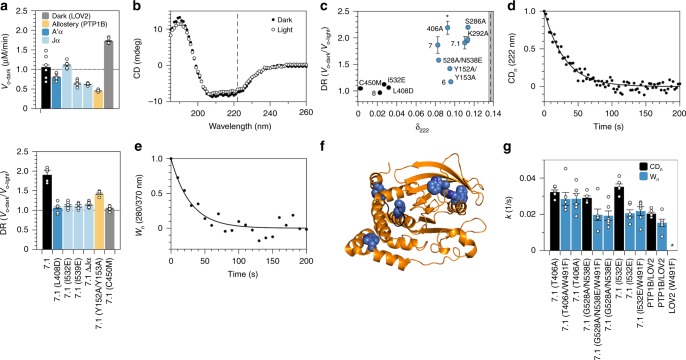
Fig. 2. Analysis of allosteric communication in PTP1BPS.
a Mutations that either prevent adduct formation in LOV2 (C450M), destabilize the A’α and Jα helices (I532E, I539E, and ΔJα), or disrupt the allosteric network of PTP1B (Y152A/Y153A) reduce the photosensitivity of 7.1 and, with the exception of I532E and C450M, lower its specific activity. The plotted data depict the mean, SE, and associated estimates of DR for n = 6 independent experiments. b Exposure of PTP1BPS to 455 nm light reduces its α-helical content (i.e., the mean residue ellipticity [MRE] at 222 nm). c An analysis of different chimeras indicates that light-induced changes in α-helical content (i.e., δ222 = [CD222-dark−CD222-light]/CD222-dark, or the fractional change in MRE at 222 nm) are necessary, but not sufficient for light-sensitive catalytic activity (i.e., high DR). Mutations correspond to variants of 7.1. Chimeras with large values of δ222 appear in blue; the dashed line indicates δ222 for equimolar amounts of free PTP1B and LOV2. Error bars denote SE for n = 6 independent reactions. d, e Thermal recovery of (d) α-helical content (i.e., the change in MRE at 222 nm normalized by the full change over 250 s) and (e) tryptophan fluorescence (i.e., the change in fluorescence normalized by the full change over 250 s) of PTP1BPS. f A crystal structure of PTP1B (pdb entry 2f71) shows the locations of six tryptophan residues (blue) and the WPD loop (black). g Kinetic constants for thermal recovery are larger for α-helical content than for tryptophan fluorescence (the latter of which is not affected by W491; *, unmeasurable). The discrepancy between these constants is smallest for PTP1BPS (i.e., 7.1(T406A)). The plotted data depict the mean, associated data points, and SE for n = 6 independent reactions. Source data are provided as a Source Data file.

