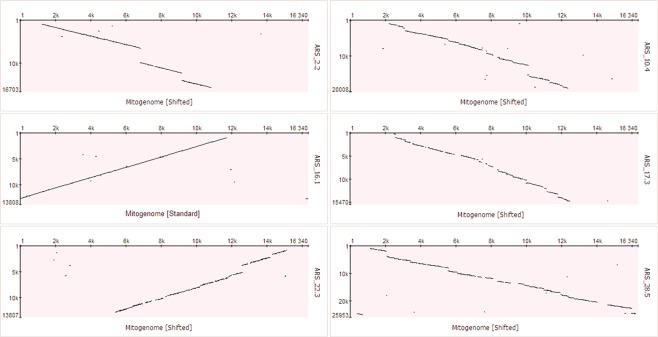
Figure 4.
Dot plots representing the alignment of large NUMT regions with the bovine mitogenome, based on results obtained from NUMTs discovered with the ARS_UCD1.2 genome assembly. Mitochondrial DNA sequence is plotted on X axis and NUMT regions are plotted on Y axis. The positions indicated in the axes of the dot plots start at 1 and go to the complete length of the sequence. Therefore, dot plot representations are not in the same scale for the Y axis and the positions of the shifted representation of the mitochondrial DNA is not adjusted for differing linearization cut-points.

