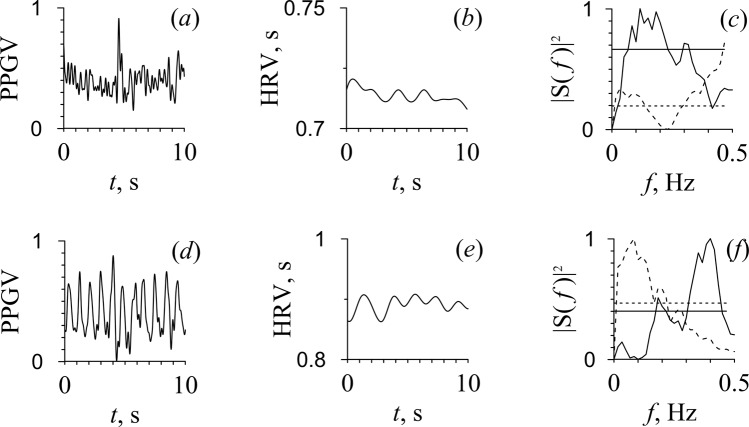
Figure 2.
PPG signal (a,d), RR intervals (b,e), and their Fourier power spectra (c,f) depicted by solid line for PPG and by dashed line for RR intervals. The dashed and solid horizontal lines in (c,f) correspond to the critical power value (p = 0.05), estimated from RR intervals and PPG signals, respectively. The upper line (a–c) corresponds to patient D with low amplitude of PPG and bottom line (d–f) corresponds to patient A with a distinguishable pulse wave under CPB.

