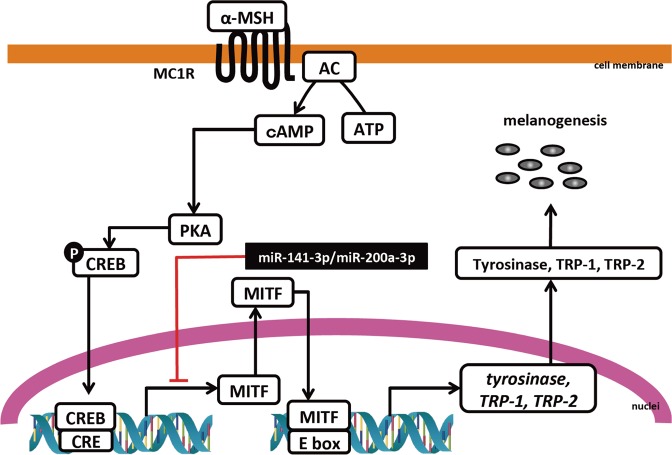
Figure 7.
Schematic overview of the regulatory mechanisms of miR-141-3p and miR-200a-3p in α-melanocyte stimulating hormone (α-MSH)-stimulated melanogenesis. (The double helix drawing in Fig. 7 has been obtained from Database Center for Life Science, http://togotv.dbcls.jp/ja/togopic.2018.23.html. DCLB is licensed under Creative Commons Attribution 4.0 International license (CC-BY-4.0). TOGO picture gallery in DCLB is released free of charge so that anyone can view and use it freely).

