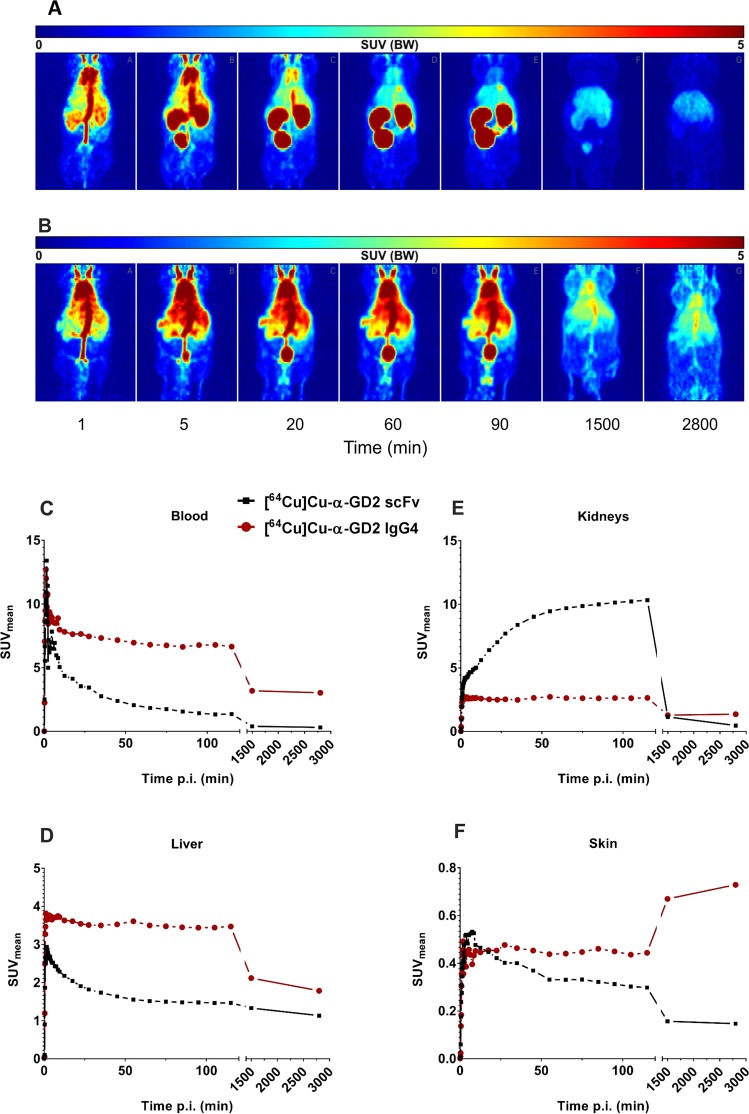
Figure 10.
PET analysis of radiolabelled scFv- and IgG4-based α-GD2 TMs in vivo. TMs were modified with the chelator NODAGA and radiolabelled with 64Cu yielding (A) [64Cu]Cu-NODAGA-α-GD2 scFv or (B) [64Cu]Cu-NODAGA-α-GD2 IgG4-based TM, which were intravenously injected into NMRI-Foxn1nu/nu mice. Subsequently, PET scanning was performed at several time points. Coronal sections of the mice are shown. In addition, dynamic PET scans were performed over a period of 50 hrs. Time curves were constructed using mean activity concentration (SUV (g/ml)) in (C) blood, (D) liver, (E) kidneys, and (F) skin. SUV, standardized uptake value; p.i., post-injection.

