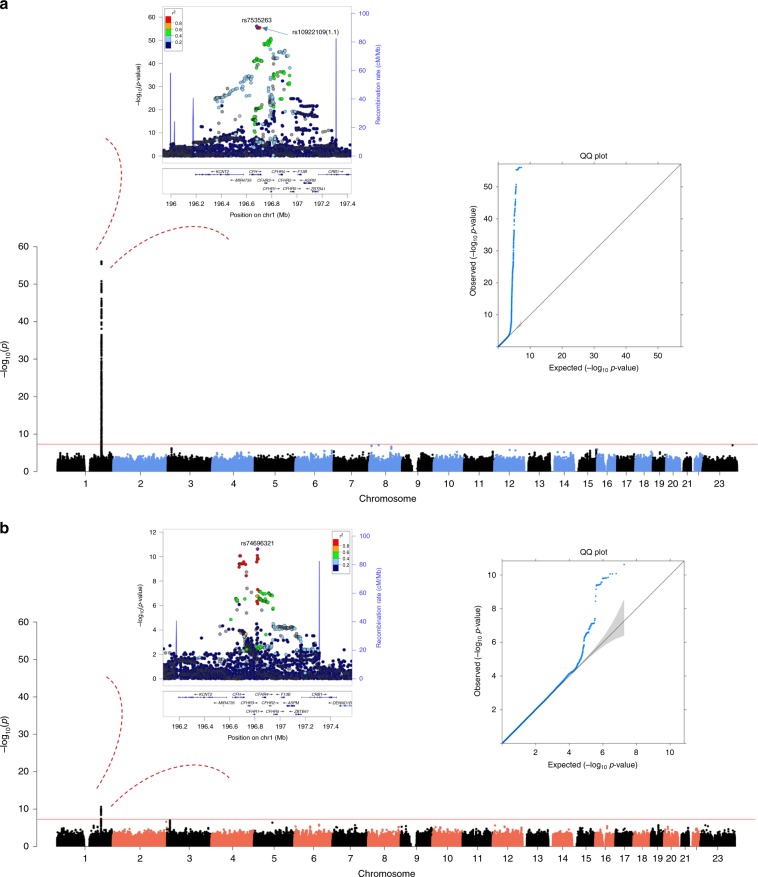
Fig. 4. GWAS meta-analysis of FHR-4 levels reveals a strong signal spanning the CFH locus.
Each panel shows a Manhattan plot, a regional plot (upper left-hand side) and a quantile–quantile (QQ) plot (upper right-hand side) for the results of the GWAS meta-analysis of FHR-4 levels (a) and FH levels (b). Manhattan plots illustrate P values (Wald test) for each single variant tested for association with log(levels). Observed −log10(P values) are plotted against the genomic position of each variant on chromosomes 1–22 plus the X chromosome. The horizontal red line indicates the threshold considered for genome-wide significance (P value ≤ 5 x 10⁻⁸). Regional plots show the only genome-wide association signal observed, that is, at the CFH locus (on chromosome 1q31.3). The most associated variant is denoted by a purple circle and is labelled by its rsID. The other surrounding variants are shown by circles coloured to reflect the extent of LD with the most associated variant (based on 1000 Genomes data, November 2014). A diagram of the genes within the relevant regions is depicted below each plot. Physical positions are based on NCBI RefSeq hg19 human genome reference assembly. QQ plots compare the distribution of the observed test statistics with its expected distribution under the null hypothesis of no association. A marked departure from the null hypothesis (reference line) is seen in the meta-analysis of FHR4 levels. Genomic inflation values (λ) were equal to 1.008 and 1.005 from the GWASs of FHR-4 levels and 1.002 and 1.014 from the GWASs of FH levels, in the Cambridge and EUGENDA studies, respectively.

