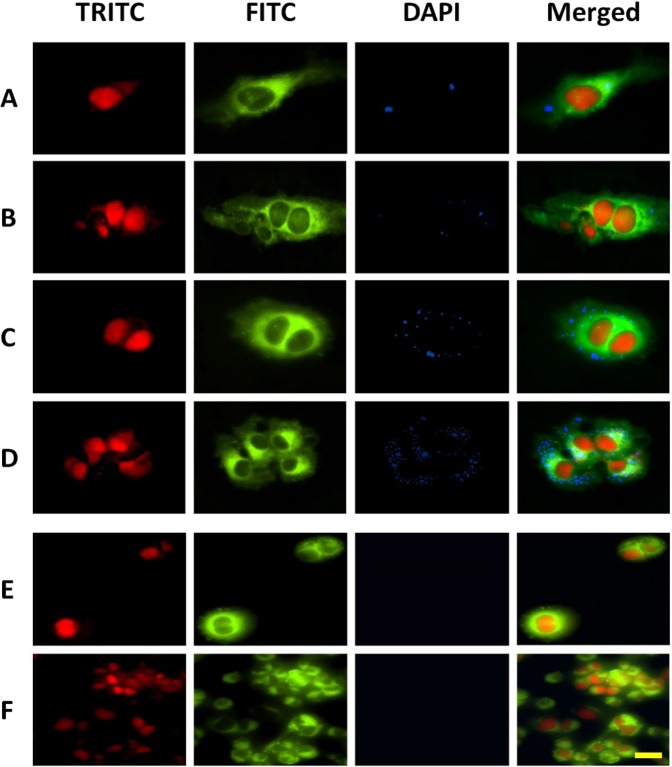
Figure 4.
Fluorescence microscopy images of the cell nucleus (stained with ethidium bromide and observed by the TRITC filter), the cytoplasm (stained with FITC), the autofluorescent particles (observed by the DAPI filter) and the three of them (merged). Study the NBc internalization extent into the cardiomyocytes upon time from 6 (B), 7 (C) and 8 (D) h, with respect to the corresponding PNcs incubation for 14 h (A), as control of internalization efficiency, and the negligible internalization of the NBc in liver (E) and lung (F) cells after 8 hours’ incubation, as control of cell specificity. The scale is 25 μm.

