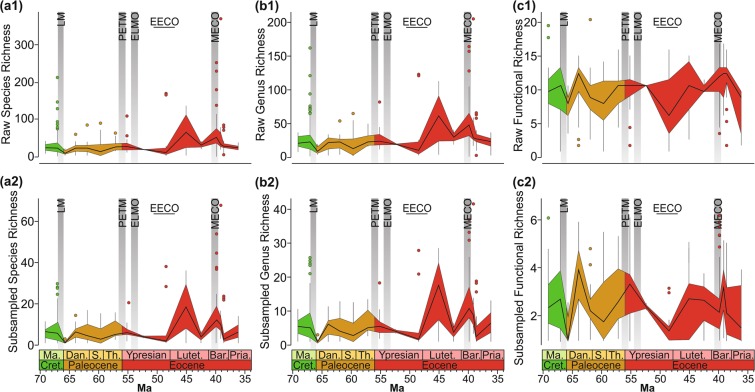
Figure 1.
Changes in the diversity of molluscan assemblages during the Late Cretaceous-Eocene interval along the Gulf Coastal Plain. Raw species richness (a1), generic richness (b1), and functional richness (c1) of faunal samples. Subsampled species-level richness (a2), genus-level richness (b2), and functional richness (c2) using the SQS method17. Solid black line is the median, the top and bottom of the shaded area corresponds to the first and third quartiles, and the vertical lines represent the lowest and highest datum within 1.5 times of the interquartile range. Points outside of these lines are outliers. The Late Cretaceous and early Cenozoic hyperthermal events discussed in the text are highlighted by vertical grey bars: LM = Latest Maastrichtian, PETM = Paleocene/Eocene Thermal Maximum, ELMO = Eocene Thermal Maximum 2, MECO = Middle Eocene Climatic Optimum. The climax of the early Eocene long-term warming trend is shown by a horizontal bar, i.e., the Early Eocene Climatic Optimum (EECO). Abbreviations: Ma. = Maastrichtian, Cret. = Cretaceous, Dan. = Danian, S. = Selandian, Th. = Thanetian, Lutet. = Lutetian, Bar. = Bartonian, Pria. = Priabonian. Note: samples with <50 specimens were excluded from the analysis. The number of samples in each time interval is shown in Table S1.

