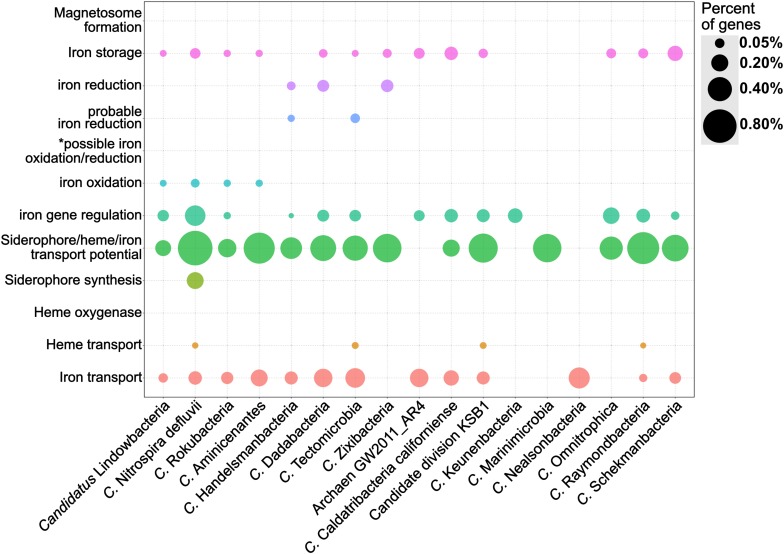
FIGURE 6.
Dot plot showing the relative abundance of different iron gene categories in 17 genomes from the Candidate Phyla Radiation and other candidate taxa. The genomes were obtained from the NCBI RefSeq and GenBank databases and analyzed by FeGenie. *This category is reserved for genes related to the MtoAB/PioAB gene family.

