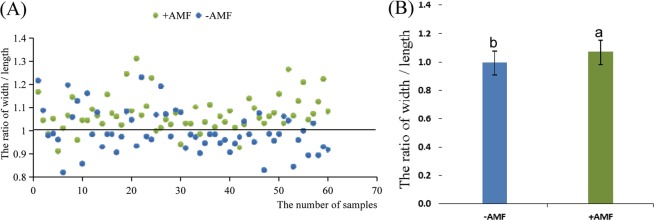
Figure 1.
The width/length ratio of the functional leaf. (A) Scatter plot of the distribution of strong and weak functional leaves; (B) Statistical analysis of the difference between strong and weak functional leaves. If the value of width/length >1, the cotton seedlings will grow rapidly. If the value of width/length <1, the cotton seedlings will grow slowly. The proportion of strong seedings with (+AMF) and without (−AMF) AMF are 90% and 35% respectively. The means ± standard error values are shown in the figure. Bars labeled with a different letter at the top of each parameter show a significant difference at P < 0.05 by one-way ANOVA.

