Figure 3.
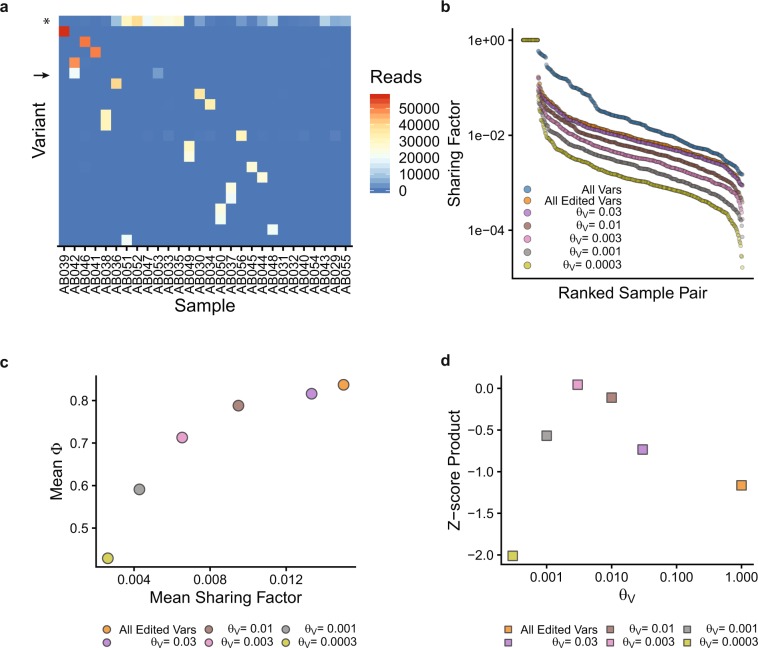
Identification of informative GESTALT barcodes. (a) Plot of GESTALT variants by sample. Only variants with read count > 20,000 in any sample are shown. Color indicates read count for each variant. Asterisk indicates the unedited GESTALT allele. Arrow indicates a high-frequency shared allele. (b) Sharing Factor curves for all pairwise combinations of samples, grouped by threshold, θV. All Vars: All detected GESTALT variants; All Edited Vars: All edited GESTALT variants with θV = 1.0. (c) The mean Sharing Factor and mean fraction of informative reads remaining after removing common variants and unedited GESTALT alleles (mean Φ) are plotted. (d) The Z-score of mean Φ times the Z-score of 1-mean Sharing factor (Z-score Product) is plotted at each value of θV.

