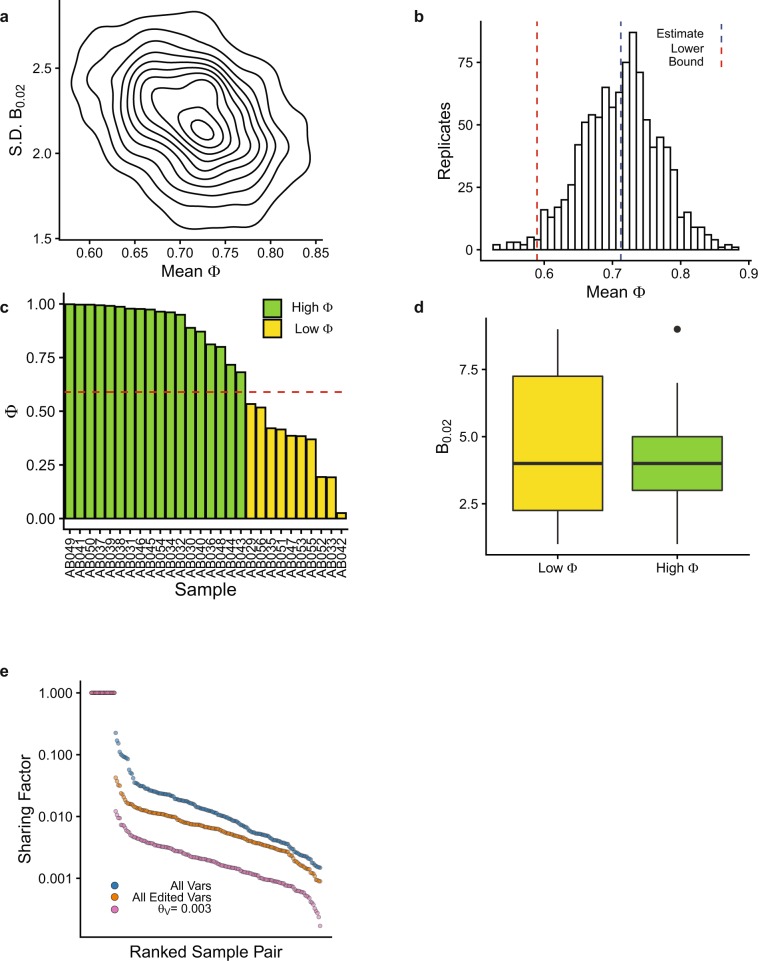
Figure 4.
Systematic selection of samples with a high fraction of informative reads. (a,b) The fraction of informative reads and number of barcodes with VAF > 0.02 was calculated for each sample in the training set. (a) Contour plot of N = 1000 bootstrap replicates for the standard deviation of the number of barcodes with VAF > 0.02 and the mean Φ, r = −0.34. (b) Histogram showing the bootstrap estimate and lower bound of the 95% confidence interval using the bias-corrected, accelerated method. (c) Fraction of informative reads in each training sample. Red line indicates the confidence interval from b. (d) Number of barcodes with VAF > 0.02 in the training samples with low and high fraction of informative reads. Box and whisker plots show median, 1st and 3rd quartiles, and 1.5 x the interquartile range. (e) Sharing Factor curves for the samples with a high Φ including all GESTALT variants (blue), all edited GESTALT variants (orange), and all remaining variants at the algorithmically selected final value of θV (pink).

