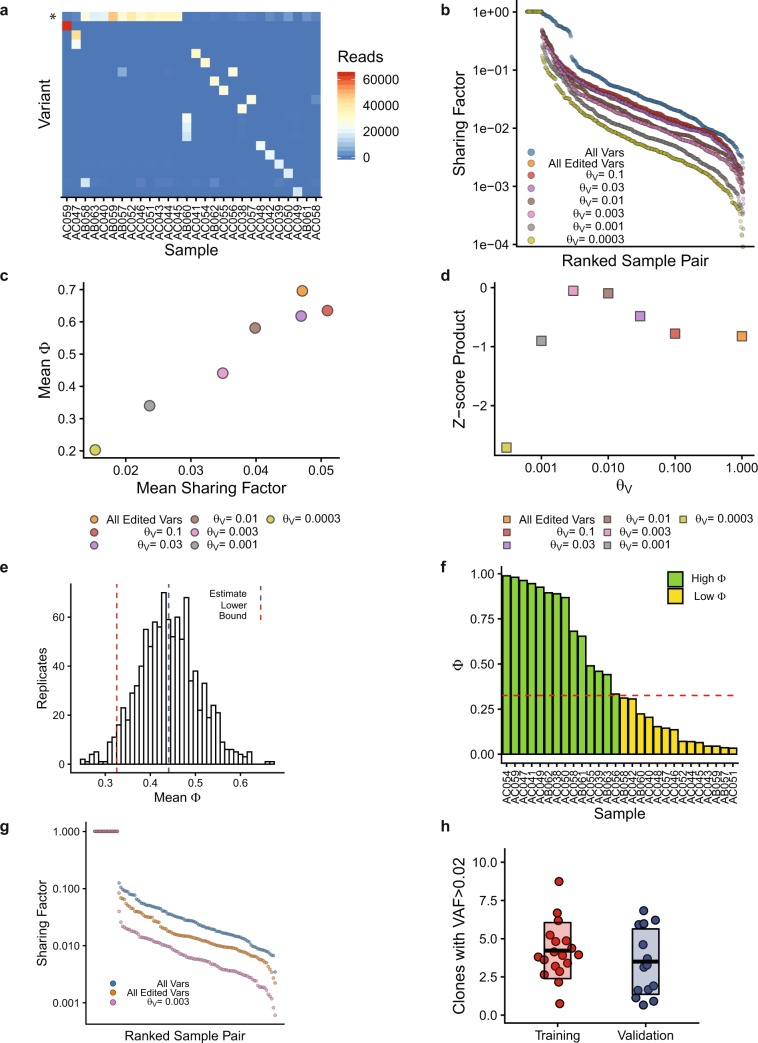
Figure 6.
Comparison of training and validation sets. (a) Heatmap of GESTALT variant read counts. Asterisk indicates the unedited GESTALT allele. (b) Sharing factor curves for all GESTALT variants, all edited GESTALT variants and at indicated values of θV. (c) Mean Φ plotted versus mean Sharing Factor at indicated values of θV. (d) Z-score product plotted at indicated values of θV. (e) Bootstrap analysis of the validation set with estimate and lower bound of the 95% confidence interval. (f) Histogram showing samples with a high and low fraction of informative reads. (g) Sharing Factor curves at the algorithmically selected final value of θV. (h) Number of GESTALT HSC clones with VAF > 0.02 in the training and validation sets. Boxes show mean and standard deviation.

