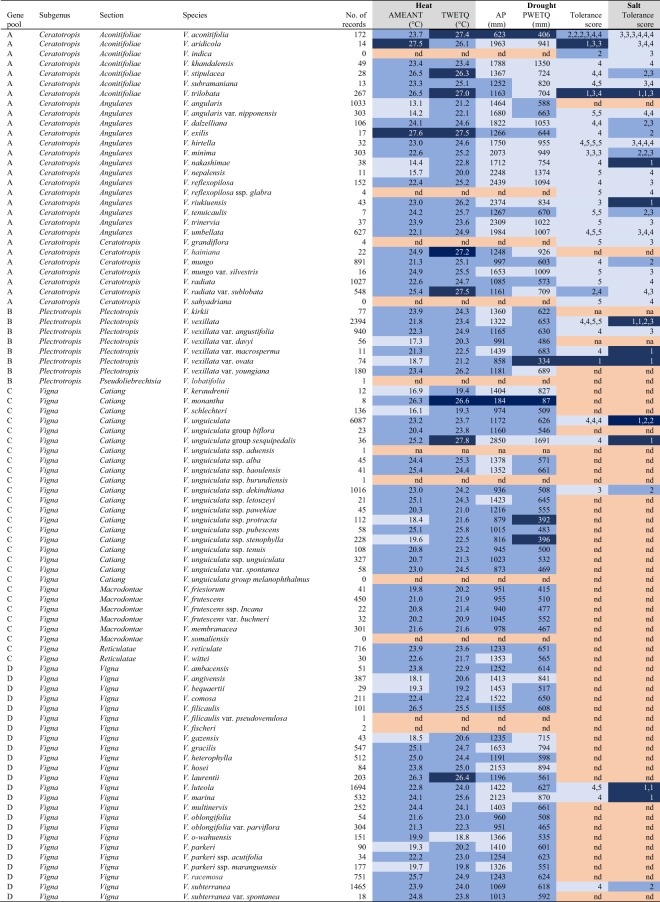
Figure 2.
Abiotic stress tolerance of 88 Vigna species. The tolerance of these species was assessed for six variables: (1) Mean value of Annual Mean Temperature across the distribution of presence records (AMEANT); (2) Mean value of Temperature in the Wettest Quarter (TWEQ); (3) Mean value of Annual Precipitation (AP); (4) Mean value of Precipitation in the Wettest Quarter (PWETQ); (5) Drought tolerance score after lab screening carried out by Iseki et al.11 in which 1 indicates high tolerance while 5 indicates low tolerance; (6) Salinity tolerance score after lab screening carried out by Iseki et al.16 in which 1 indicates high tolerance while 5 indicates low tolerance. The four climate variables were calculated with data from WorldClim28. The colour of the cells indicates the level of tolerance for a specific variable. Darkblue indicates presence in harsh climate conditions or a high tolerance score in pot experiments. Intermediate blue indicates presence in intermediate climates or a suboptimal tolerance score in pot experiments. Light blue indicates presence in temperate or humid climate conditions or a poor tolerance score in pot experiments. Salmon indicates no data (nd).

