Figure 2.
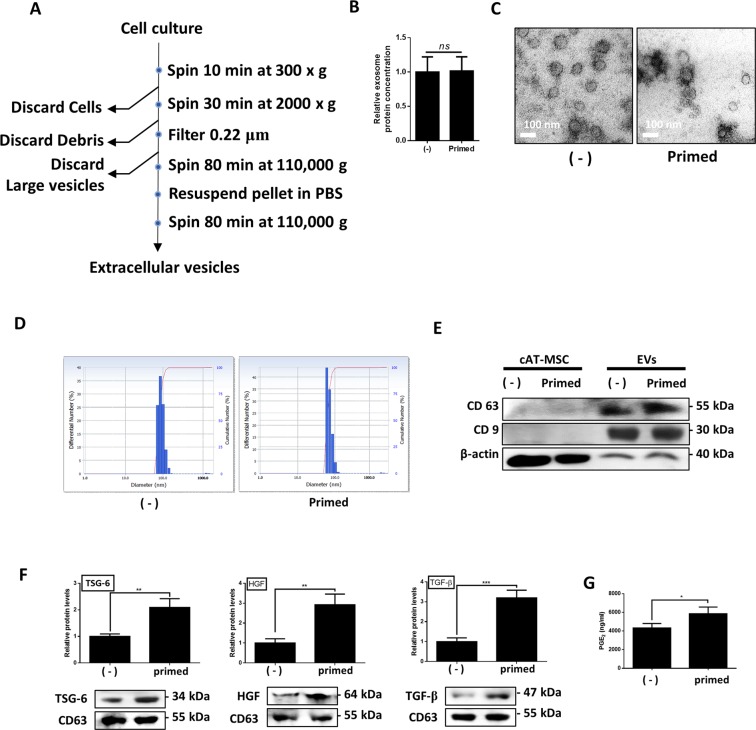
Characterization and immunomodulatory factors naïve- and primed cASCs derived EVs. (A) Scheme of EVs isolation. (B) Relative protein concentration of EVs produced from naïve or primed cASCs (C) Representative electron micrograph of EVs isolation from naïve or primed cASCs. Bar = 100 nm. (D) Nanoparticle tracking analysis of EVs obtained from naïve or primed cASCs. The size of EVs ranged from 30–120 nm. (E) Representative image of western blot for the presence of CD63, CD9 and β-actin in cASCs and EVs isolation from naïve or primed cASCs. (F) The TSG-6, HGF and TGF-β levels in EVs from primed cASCs were higher than in EVs from naïve cASCs using western blot analysis. (G) In ELISA, higher levels of PGE2 concentration was measured in EVs of TNF-α and IFN-γ-primed cASC than in EVs of naïve cASC. Data are shown as mean ± S.D. (ns = Not Statistically Significant. *P < 0.05, **P < 0.01, ***P < 0.001, ****P < 0.0001 by unpaired two-tailed Student’s t-test).

