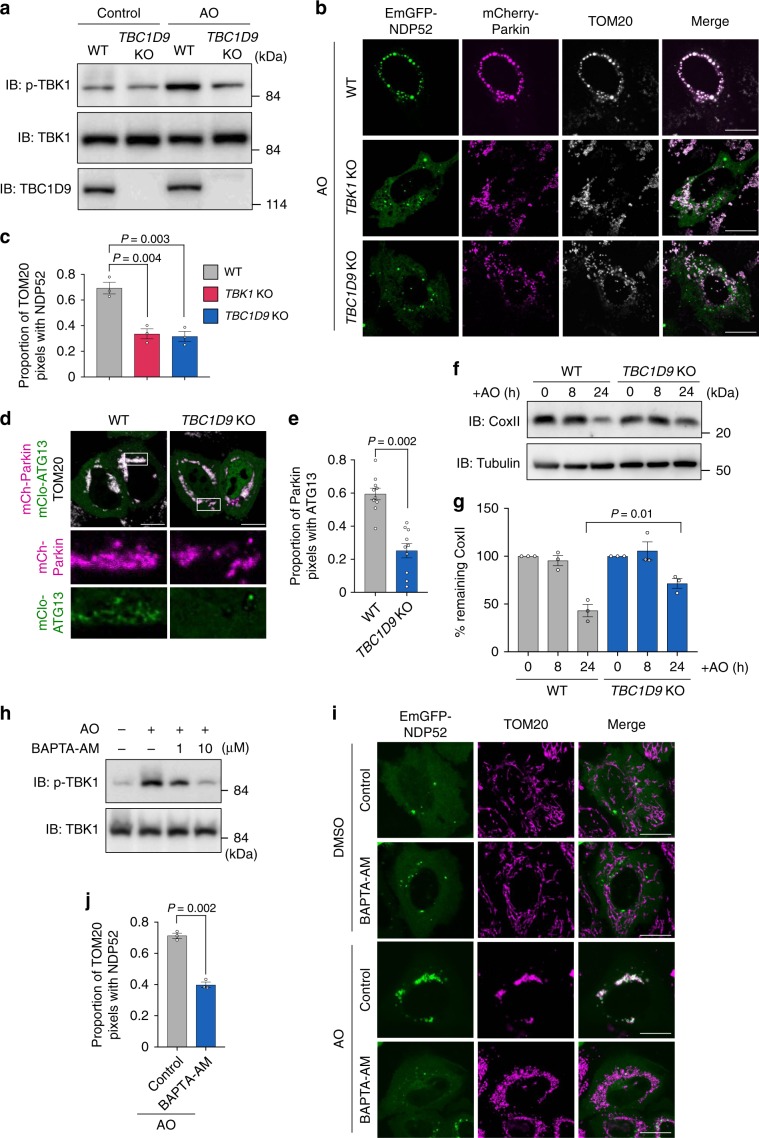
Fig. 6. Ca2+ and TBC1D9 are required for TBK1 activation during mitophagy.
a HeLa WT or TBC1D9-KO cells expressing mCherry-Parkin were depolarized with AO for 2 h. b, c HeLa WT, TBK1-KO, and TBC1D9-KO cells expressing EmGFP-NDP52 and mCherry-Parkin were depolarized with AO for 4 h and immunostained for TOM20. b Representative confocal micrographs and c the proportion of TOM20 puncta colocalized with NDP52 from at least 20 randomly selected cells in each experiment. d, e HeLa WT and TBC1D9-KO cells expressing mCherry-Parkin and mClover-ATG13 were depolarized with AO for 4 h and immunostained for TOM20. d Representative confocal images and e quantification of ATG13 recruitment to Parkin-positive clustered mitochondria. f, g Mitophagy activity in TBC1D9-KO cells. f Cell lysates from TBC1D9-KO cells expressing mCherry-Parkin after AO treatment were immunoblotted and g quantified for COXII degradation. h HeLa cells expressing mCherry-Parkin were depolarized with AO for 2 h in the presence or absence of BAPTA-AM. i, j HeLa cells expressing EmGFP-NDP52 and FLAG-Parkin were depolarized with AO for 4 h in the presence or absence of BAPTA-AM and immunostained for TOM20. i Representative confocal micrographs and j the proportion of TOM20 puncta colocalized with NDP52 from at least 20 randomly selected cells in each experiment. Data in (c) (n > 20 cells per condition), (e) (n > 5 cells per condition), (g), and (j) (n > 10 cells per condition) represent the mean ± SEM of three independent experiments. P values calculated by two-tailed Student’s t test.

