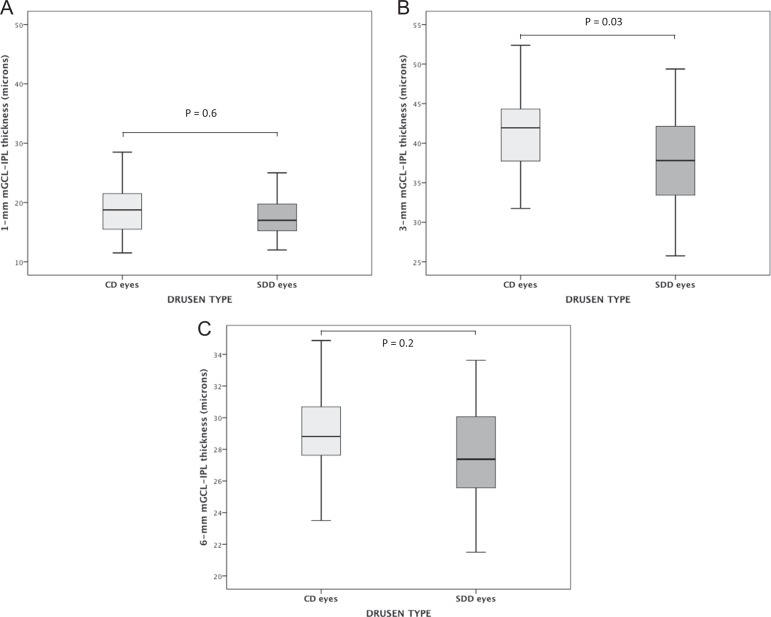
Fig. 3.
Box-plots of macular ganglion cell layer-inner plexiform layer (GCL-IPL) thickness in eyes with conventional drusen (CD) and subretinal drusenoid deposits (SDD), (a, b, and c), respectively. P-values shown in the figure result from the general linear model analysis adjusted for sex, age, axial length, and spherical equivalent as covariates

