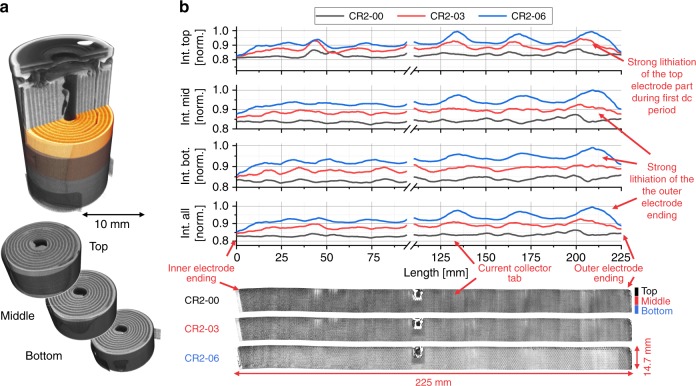
Fig. 6. Organisation of electrode unrolling (top, middle, bottom) and analysis of the lithium distribution in the LixMnO2 electrode during discharging using neutron tomography data.
The analysis of the lithium intercalation in the LixMnO2 electrode is divided in four sections, the top, middle, bottom and overall part. a shows the pristine neutron tomogram divided in the studied parts. b displays the unrolled and over the thickness averaged electrodes of the pristine (CR2-00), partly discharged to −225.71 mAh (CR2-03) and partly discharged to −580.55 mAh (CR2-06) SoC and the related line plots. The intensity increase, due to the lithium intercalation, during discharging is clearly visible. On the top, the electrode undergoes a very strong lithiation during the first period of discharging. Over the electrode length, a sinusoidal intensity profile with increasing period is observed, with maxima at the tab side. This structure is caused by a higher lithium content on that side.

