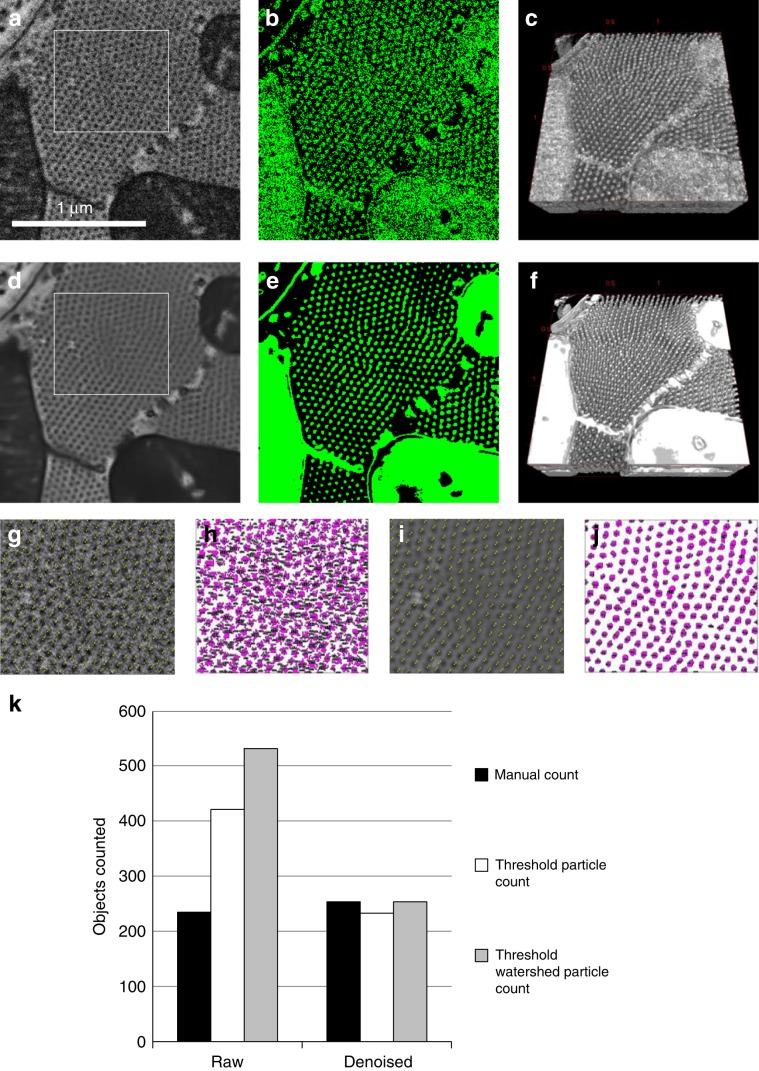
Fig. 6. Denoising influence on sarcomere segmentation and counting in mouse heart tissue FIB-SEM data.
A 3D ROI from a FIB-SEM data set, acquired at isotropic 5-nm resolution, from mouse heart tissue was used for denoising. a An XY view of 330 × 300 pixels of the raw image. b The image was used for creating a mask (in green) by intensity thresholding. c This mask was used for 3D rendering with the ImageJ 3D Viewer. d The data were denoised with DenoisEM, using the NLM algorithm, and e, f segmented by thresholding. g The ROI indicated in panel (a) was used for manual counting of sarcomeres with the ImageJ Cell Counter Plugin. h Each item counted is indicated with a magenta dot. Panels (i) and (j) show the counting results on the denoised data. k A graph showing the number of sarcomeres counted, either manual by three different individuals or by the ImageJ Analyse Particles tool on a thresholded image, with or without watershed.

