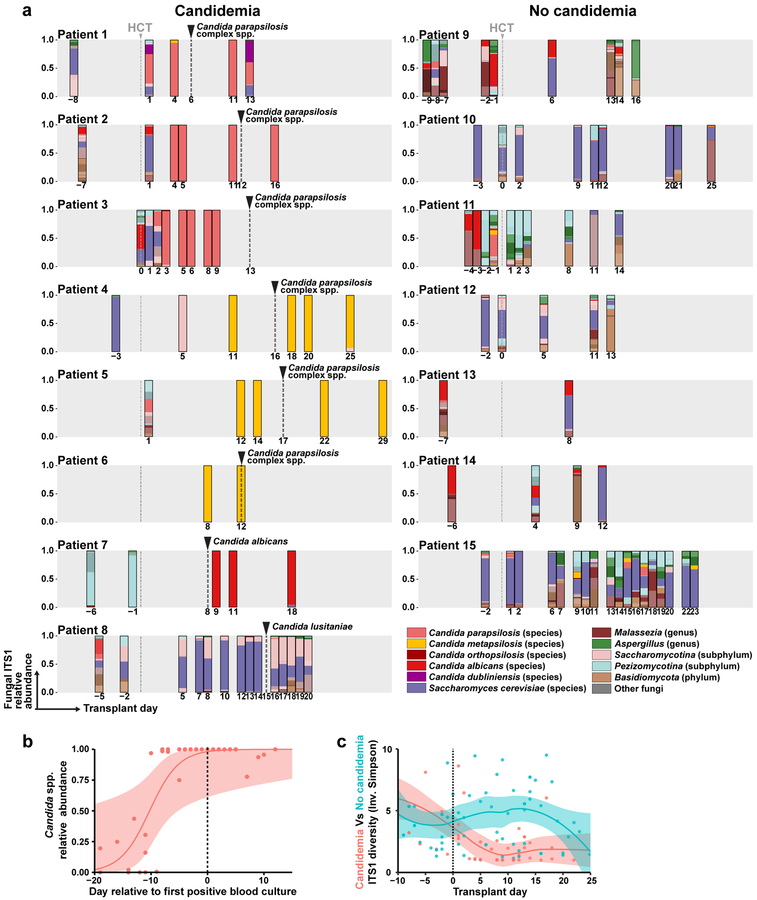
Fig. 2: Mycobiota dynamics in allo-HCT patients.
a, Species-level taxonomy of fecal mycobiota (average: 7 samples per patient, range: 2 – 18) from allo-HCT patients with (left column) and without (right column) candidemia, colored according to the legend. Frequent species, e.g. Candida species and Saccharomyces cerevisiae, were individually color-coded. The grey box indicates day −10 to day +30 of transplant and the grey dashed line indicates the day of transplant. The number below each bar graph indicates the day of sampling. The black dashed line and arrow indicate the day of first fungal BSI in the candidemia group. b, Quantification of total relative abundance of pathogenic Candida species of each fecal sample (n = 37) from patients 1 to 7, a solid line represents the dynamic trend, with the shaded area indicating the 95% confidence interval. c, α-diversity of mycobiota in each sample, measured by the Inverse Simpson index. Red dots and line: candidemia group (n = 51); green dots and line: non-candidemia group (n = 57).

