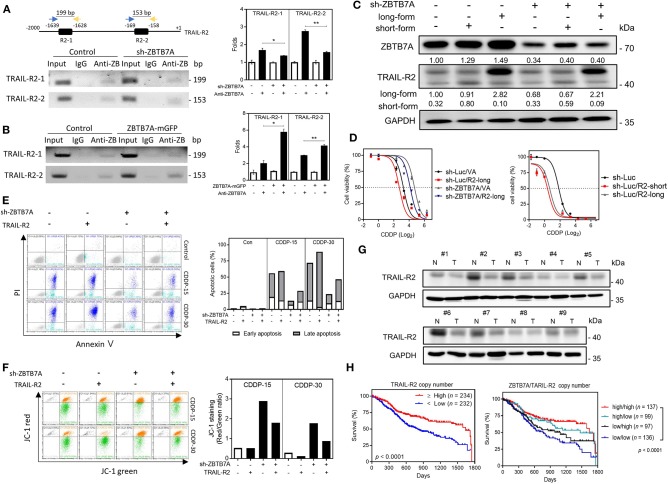
Figure 5.
ZBTB7A sensitizes SAS cells to CDDP by trans-activation TRAIL-R2. (A) Lt Upper, schematic diagram depicting the ChIP strategy. R2-1 and R2-2 are predicted to be ZBTB7A binding sites in the TRAIL-R2 promoter. (A, Lt Lower; B, Lt) Representative gel electrophoresis images of the PCR analysis; these reveal the amplicons of R2-1 and R2-2 sequences using the various immunoprecipitates, namely control, ZBTB7A knockdown and ZBTB7A exogenous expression cells. (A,B, Rt), quantification. The analysis indicates that ZBTB7A expression increases, and ZBTB7A knockdown decreases the binding of the ZBTB7A to TRAIL-R2-1 and TRAIL-R2-2 sites, respectively. Anti-Z: anti-ZBTB7A antibody. (C,D) Long-form and short-form TRAIL-R2 expression, respectively. Lt, Western blot analysis confirming the expression of TRAIL-R2 in the SAS ZBTB7A knockdown cell subclone by means of TRAIL-R2 retroviral infection. Rt, CDDP sensitivity as related to expression of ZBTB7A and TRAIL-R2. (E) Apoptosis assay. Lt, flow cytometry diagram. Rt, quantification. The CDDP-induced apoptosis is decreased by ZBTB7A knockdown and this is reversed by TRAIL-R2 expression. (F) Lt, Mitochondrial membrane potential analysis. Rt, Quantification of the red/green ratio. Following 15 or 30 μM CDDP for 48 h, the increase in the red/green ratio as a result of ZBTB7A knockdown is reversed by TRAIL-R2 expression. (G) Western blot analysis of paired OSCC tissue samples. TRAIL-R2 expression is clearly downregulated in the OSCC tissue samples. N, NCMT; T, OSCC. (H) Kaplan-Meier analysis of the overall survival in relation to ZBTB7A copy number and TRAIL-R2 copy number. ns, not significant; *p < 0.05; **p < 0.01.

