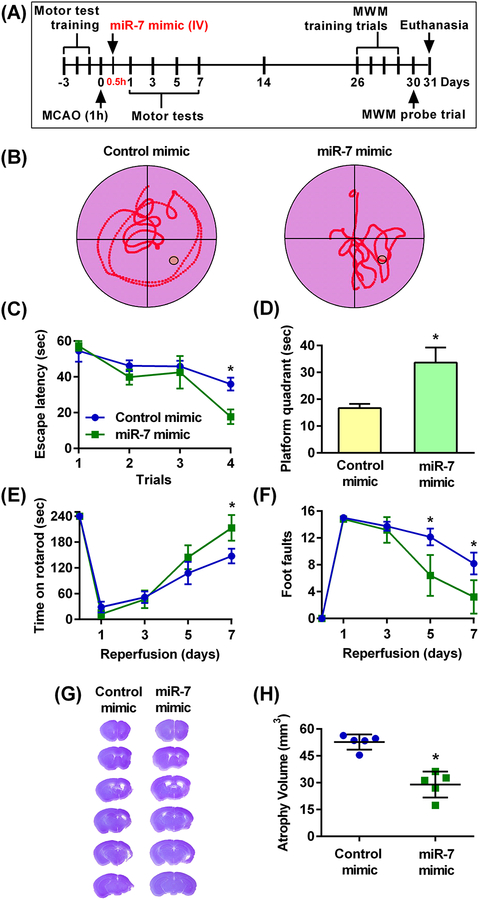
Fig. 5: Post-ischemic IV administration of miR-7 mimic decreased the cognitive deficit and accelerated motor recovery in young male mice.
(A) Schematic diagram of the experimental design, wherein young male mice were subjected to 60 min (1h) transient MCAO followed 30 min (0.5h) thereafter (during reperfusion) by injection of the miR-7 or control mimics. Motor training was performed for 3 days prior to transient MCAO and motor performance was then assessed at days 1–7 of reperfusion. Training trials for the Morris water maze (MWM) test were initiated at 26 days of reperfusion for 4 days followed by the probe trial at 30 days of reperfusion. Brains were collected at 31 days of reperfusion for atrophy volume assessment. (B) Representative trace maps from the MWM tests assessing memory retention in the miR-7 mimic-treated and control mimic-treated cohorts during the probe trial. (C) Time taken by control- and miR-7 mimic-treated mice to reach the platform (”escape latency”) during the training trials. Data are mean ± SD (n = 5 mice per group). *p<0.05 compared to the corresponding control mimic group, by repeated measures ANOVA followed by Sidak’s multiple comparisons post-test. (D) Length of time mice treated with the control- or miR-7 mimic remained in the platform quadrant during the probe trial. Data are mean ± SD (n = 5 mice per group). *p<0.05 compared to the control mimic group, by Mann-Whitney U test. (E and F) Functional recovery assessed by the rotarod test (E) and the beam-walk test (F) in control- and miR-7 mimic-treated mice over 7 days of reperfusion. Data are mean ± SD (n = 5 mice per group). *p<0.05 compared to the corresponding control mimic group, by repeated measures ANOVA followed by Sidak’s multiple comparisons post-test. (G and H) Representative cresyl violet-stained serial sections (G) and atrophy volume (H) from miR-7 mimic or control mimic-treated mice. Data are mean ± SD (n = 5 mice per group). *p<0.05 compared to the control mimic group, by a Mann-Whitney U test.

