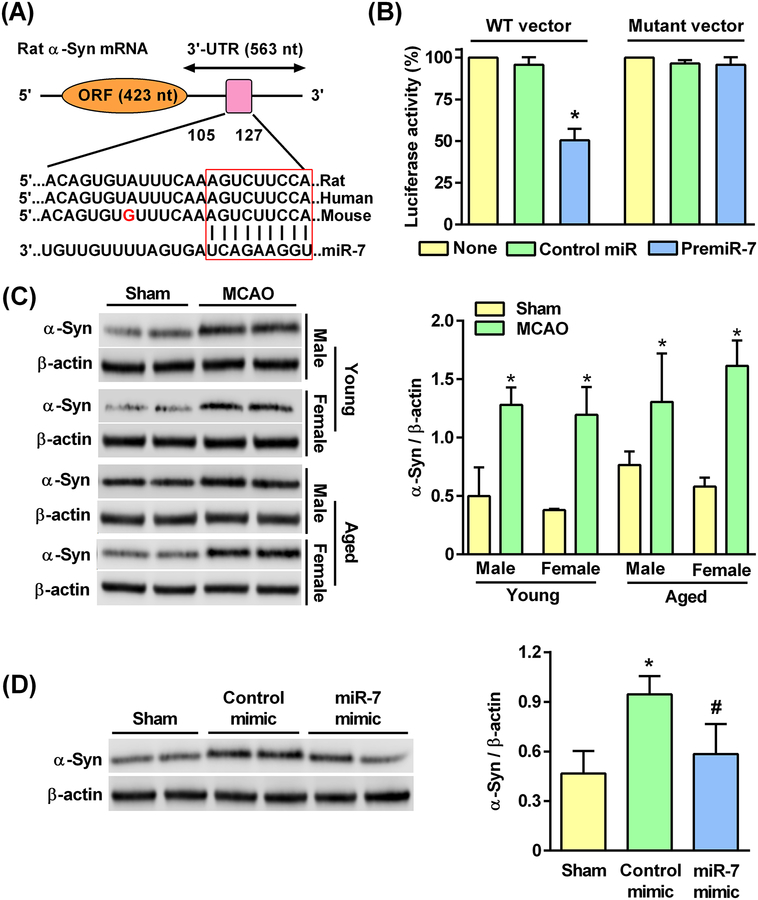
Fig. 7: miR-7 mimic treatment prevented the post-MCAO induction of α-Syn protein.
(A) The miR-7 seed sequence in the 3’-UTR of α-Syn mRNA is outlined with the red box. (B) The expression of α-Syn 3’-UTR luciferase vector when co-transfected with premiR-7 compared to a mutant vector in PC12 cells. Luciferase activities were normalized to Renilla luciferase activities and shown as percent of control miR. Data are mean ± SD (n = 4 batches of cells per group). *p<0.05 compared to the control miR group, by Kruskal-Wallis one-way ANOVA followed by Dunn’s post-test. (C) Western blot analysis of α-Syn protein levels in the cortical peri-infarct region of rats induced at 1 day of reperfusion after 60 min transient MCAO. Blots were representative of 4 independent experiments. Data are mean ± SD (n = 4 rats per group). *p<0.05 compared to corresponding sham, by Mann-Whitney U test. (D) Western blot analysis of α-Syn protein levels induced at 1 day of reperfusion after 60 min transient MCAO in the cortical peri-infarct region of young male rats treated with miR-7 mimic at 2 hours prior to 60 min MCAO. Data are mean ± SD (n = 4 rats per group). *p<0.05 compared to sham, and #p<0.05 compared to the control mimic group, by Kruskal-Wallis one-way ANOVA followed by Dunn’s post-test.

