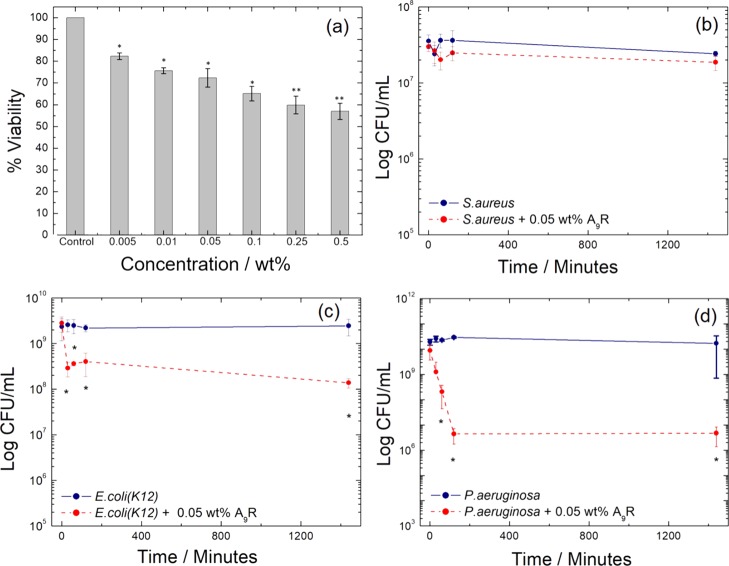
Figure 3.
(a) Cell viability profiles of A9R solutions. Error bars are SEM (n = 3). * = p < 0.05, ** = p < 0.01. Survival of three bacteria strains without (blue line) and in the presence of 0.05 wt % A9R (red dashed line) for (b) S. aureus, (c) E. coli, and (d) P. aeruginosa, where CFU = colony forming units, and the error bars represent the standard error of the mean. * = p < 0.05 as assessed by the t-test between treated and untreated strains.

