Figure 5.

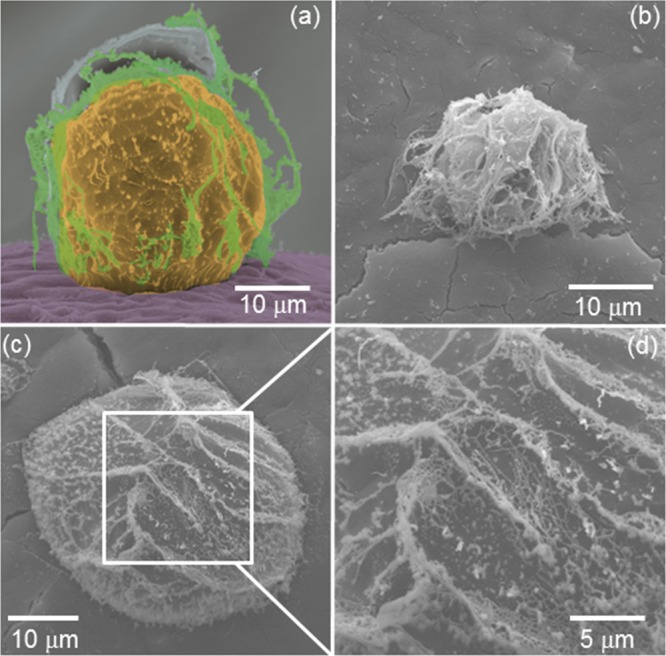
(a–d) cryo-SEM images obtained for a 0.05 wt % A9R emulsion. (a) Colorization assists the visualization of the fibril coating. The image in (d) is an enlargement of the region shown in (c).

(a–d) cryo-SEM images obtained for a 0.05 wt % A9R emulsion. (a) Colorization assists the visualization of the fibril coating. The image in (d) is an enlargement of the region shown in (c).