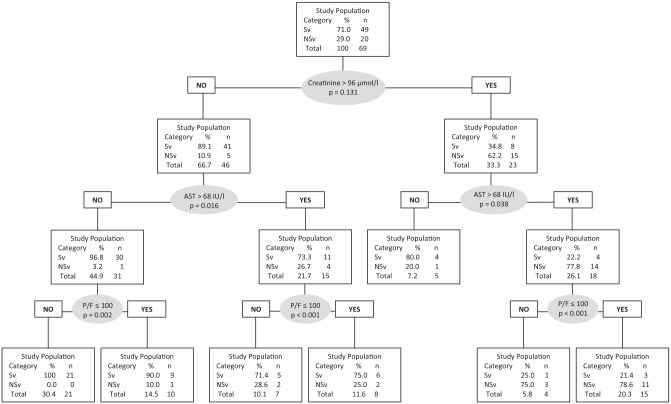
Figure 3.
Prediction model of 3-month mortality by segmentation tree (Classification and Regression Tree analysis) according to creatinine level, AST level, and P/F ratio. A value of P > .05 is significant and means predictive value improvement of the step. AST indicates alanine aminostransferase; NSv, 3-month non-survivors; P/F, O2 partial pressure/O2 inspired fraction ratio; Sv, 3-month survivors.

