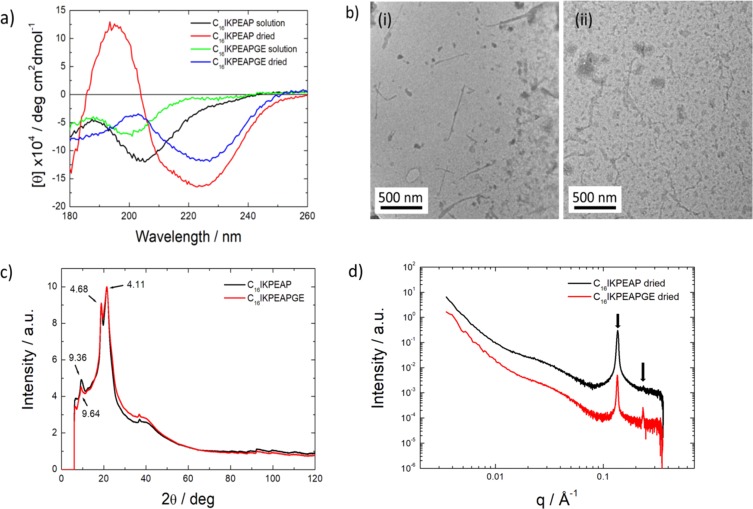
Figure 3.
(a) CD spectra obtained from dried films. (b) TEM images of dried (i) C16IKPEAP and (ii) C16IKPEAPGE at native pH showing fibers and micelles. (c) Fiber X-ray diffraction intensity profile of C16IKPEAP and C16IKPEAPGE at native pH. (d) SAXS intensity profiles of dried C16IKPEAP and C16IKPEAPGE at native pH. The arrows highlight observed Bragg reflections.

