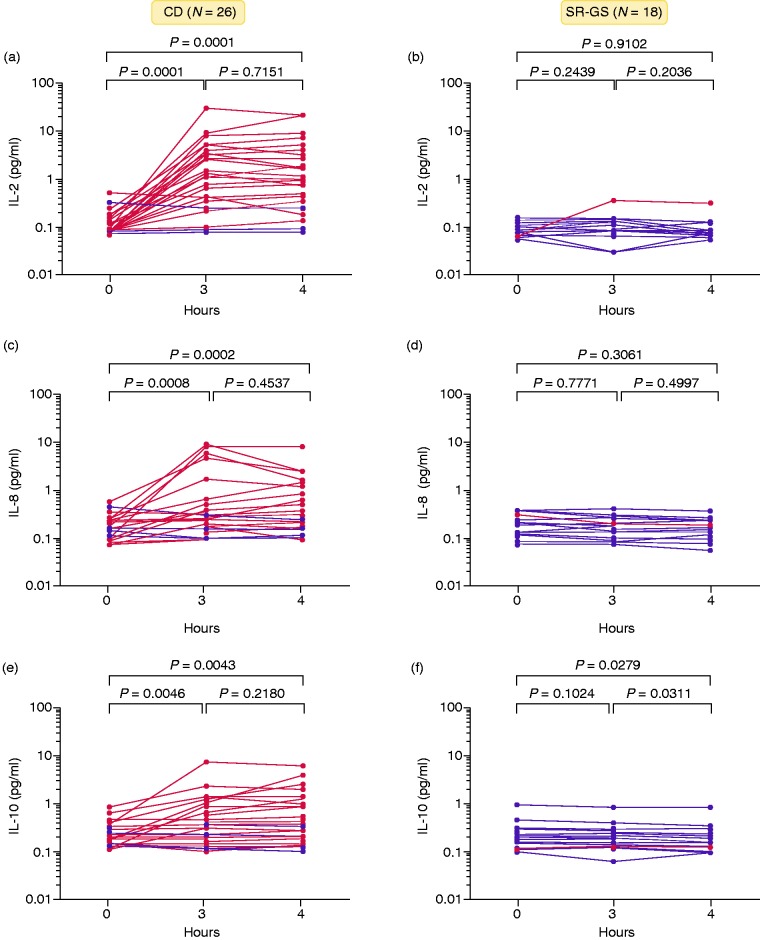
Figure 2.
Temporal cytokine response to gluten challenge in coeliac disease (CD) and self-reported gluten sensitivity (SR-GS) participants. Paired cytokine levels, pre- and post-challenge, of (a and b) IL-2, (c and d) IL-8 and (e and f) IL-10 are shown for CD and SR-GS participants in the Melbourne study. Participants who responded with a positive cytokine release to the gluten challenge are highlighted in red. Paired changes were analysed by the Wilcoxon test. Median values are listed on top of each time point for both cohorts.

