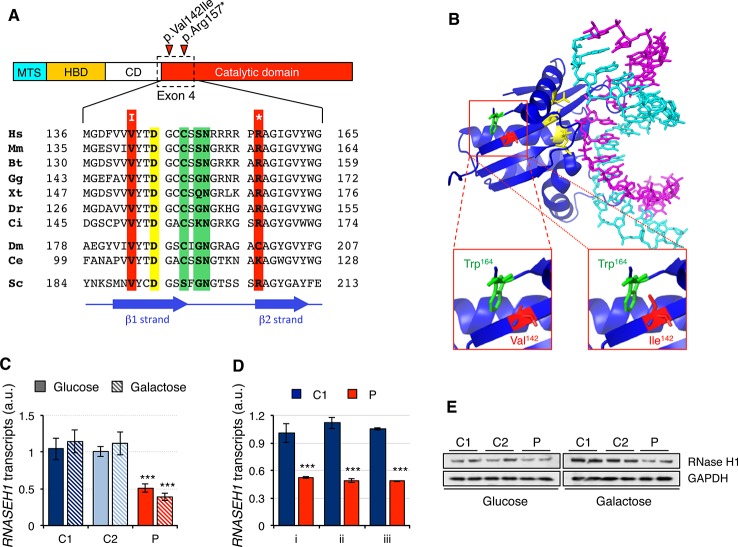
Figure 1.
RNASEH1 mutations, transcript, and protein levels. (A) Domains ofhuman RNAse H1 protein (MTS, mitochondrial targeting sequence; HBD, hybrid binding domain; CD, connection domain; catalytic domain). RNase H1 protein sequences from representative species,H. sapiens (Hs, NP_002927) M. musculus (Mm, NP_035405), B. taurus (Bt, NP_001039970), G. gallus (Gg, NP_990329),X. tropicalis (Xt, NP_001096299),D. rerio (Dr, NP_001002659), C. intestinalis (Ci, F6QPH0), D. melanogaster (Dm, NP_995777), C. elegans (Ce, NP_001040786), S. cerevisiae (Sc, Q04740), were extracted from the database and aligned using ClustalW2. Conserved residues found mutated in the patient in exon 4 are boxed in red, while residues in the active site and interacting with DNA or RNA are boxed in yellow and green, respectively. Positions of β strands are marked by blue arrows. (B) Human RNase H1 crystal structure (PDB ID 2QK9) 18 bp DNA(cyan): RNA (magenta) hybrid is shown respectively. Residues in the active site are colored in yellow. Residues Trp164 (green) and Val142, or the mutated variant Ile142 (red), are shown as sticks. (C) RNASEH1 transcript levels in control (C1 and C2) and patient (P) fibroblasts grown in either glucose- or galactose-containing medium assessed by qPCR (probe Hs00268000_m1) and normalized to GAPDH transcript levels. Data are shown as mean ± SD, n = 4, ***p < 0.001. (D) RNASEH1 transcript levels in control (C1) and patient (P) fibroblasts grown in glucose-containing medium assessed by qPCR with probes Hs00268000_m1 (i), Hs01108220_g1 (ii), and Hs01108219_g1 (iii) and normalized to GAPDH transcript levels. Data are shown as mean ± SD, n = 3, ***p < 0.001. (E) Western blot analysis of RNase H1 in control (C1 and C2) and patient (P) fibroblasts grown in either glucose- or galactose-containing medium. GAPDH was used as loading control.

