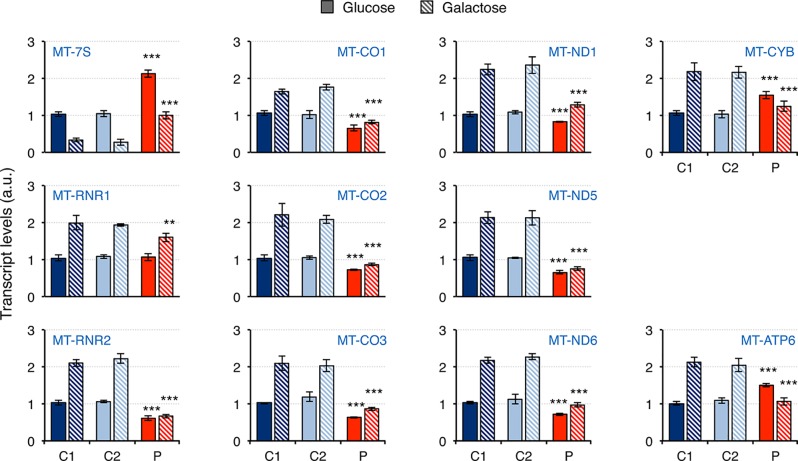
Figure 3.
Mitochondrial transcript levels in mutant RNASEH1 fibroblasts. Mitochondrial transcript levels in control (C1 and C2) and patient (P) fibroblasts grown in either glucose- or galactose-containing medium, assessed by qPCR and normalized to GAPDH transcript levels. Analyzed transcripts included the non-coding 7S RNA (MT-7S), the two ribosomal RNAs MT-RNR1 (12S rRNA) and MT-RNR2 (16S rRNA), three complex IV protein mRNAs (MT-CO1, MT-CO2 and MT-CO3), three complex I protein mRNAs (MT-ND1, MT-ND5 and MT-ND6), one complex III protein mRNA (MT-CYB), and one complex V protein mRNA (MT-ATP6). Data are shown as mean ± SD, n = 4, Student’s unpaired two-tail t-test, **p < 0.01, ***p < 0.001.

