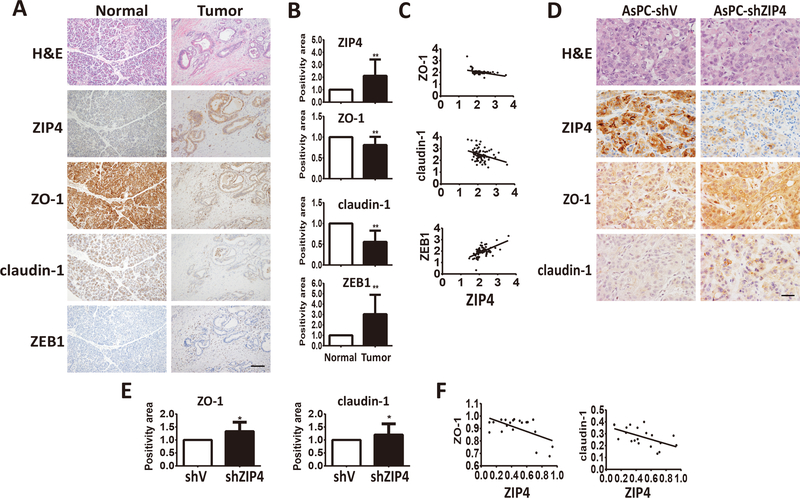
Figure 1. Correlation between ZIP4 and EMT markers in human and mouse pancreatic cancer tissues.
(A) Representative pictures of IHC staining for ZIP4 and EMT markers ZO-1, claudin-1, ZEB1 in 72 pairs of human pancreatic cancer and adjacent normal pancreas tissues. The scale bar is 100 μm. (B) Positivity of ZIP4, ZO-1, claudin-1, ZEB1 IHC staining results in 72 pairs of human pancreatic cancer and adjacent normal pancreas tissues. (C) Correlations of ZIP4 with ZO-1, claudin-1, ZEB1 in 72 human pancreatic cancer tissues. Pearson correlation coefficient was employed to quantify the correlation between the expression of ZIP4 and EMT markers in human pancreatic cancer tissue pairs. * means P value <0.05, ** means P value <0.01 which were considered statistically significant. (D) H&E staining, IHC staining of ZIP4, EMT markers ZO-1, claudin-1 in orthotopic pancreatic cancer xenografts. n=10. The scale bar is 50μm. (E) Positivity of ZIP4, ZO-1, claudin-1 in 20 xenograft tumor tissues. (F) Correlations of ZIP4 and EMT markers ZO-1, claudin-1 in orthotopic pancreatic cancer xenografts. n=10. Pearson correlation coefficient was employed to quantify the correlation between the expression of ZIP4 and EMT markers in xenograft tumor tissue. * means P value <0.05, ** means P value <0.01 which were considered statistically significant.

