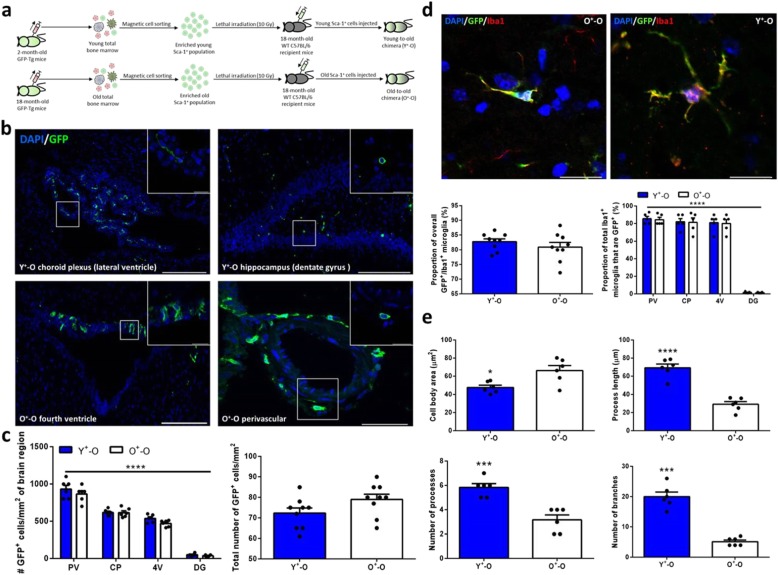
Fig. 1.
Reconstituted Sca-1+ stem cells home from the BM to the brain and differentiate into microglia. a Cartoon representation of the BM reconstitution process and chimera generation. b Immunostaining and c quantification of GFP+ cells in different brain regions with at least n = 6 mice per group. d Co-labelling and quantification of GFP+ cells with the microglial marker, Iba1, for at least n = 5 mice per group. e Quantification of GFP+/Iba1+ cell morphology for n = 5 mice per group. Scale bars, 200 μm and 20 μm for insets (b) and 20 μm and 40 μm for left and right images, respectively (c). Data are mean ± s.e.m. *P ≤ 0.05; ***P ≤ 0.001; ****P ≤ 0.0001 (unpaired two-sided t-tests (c (right), d (left), e), two-way ANOVA with Tukey’s multiple comparisons test (c (left; F (3, 31) = 339.9, P < 0.0001), d (right; F (3, 32) = 284.0, P < 0.0001)))

