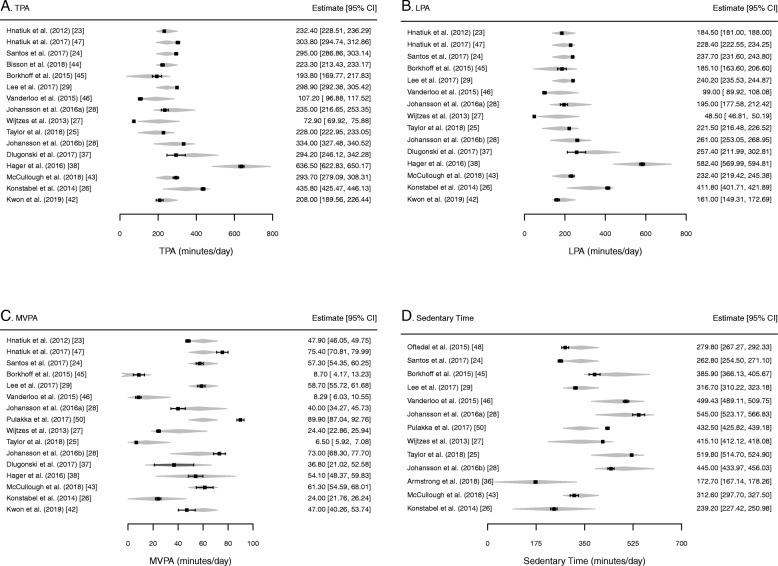
Fig. 2.
Forest plot of meta-analyses moderated by accelerometer placement, validity of cut-point, type of accelerometer, and epoch length. The polygon presented along with the effect size estimates for each study in the meta-analysis, depicts the fitted estimate. The width of this polygon represents the confidence interval surrounding this fitted estimate. TPA total physical activity, LPA light physical activity, MVPA moderate-to vigorous-intensity physical activity

