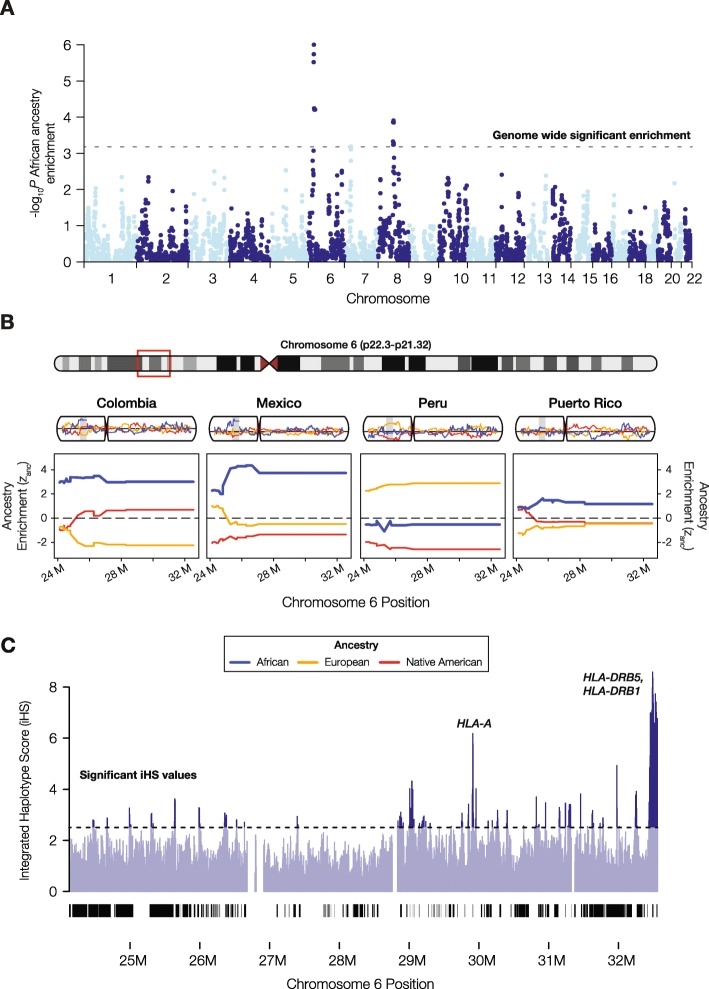
Fig. 2.
African ancestry enrichment at the major histocompatibility complex (MHC) locus. a Manhattan plot showing the statistical significance of African ancestry enrichment across the genome. b Haplotype on chromosome 6 with significant African ancestry enrichment for three of the four LA populations: Colombia, Mexico, and Puerto Rico. This region corresponds to the largest peak of African ancestry enrichment on chromosome 6 seen in a. Population-specific African (blue), European (orange), and Native American (red) ancestry enrichment values (zanc) are shown for chromosome 6 and the MHC locus. c Integrated haplotype score (iHS) values for African continental population from the 1KGP are shown for the MHC locus; peaks correspond to putative positively selected human leukocyte antigen (HLA) genes.

