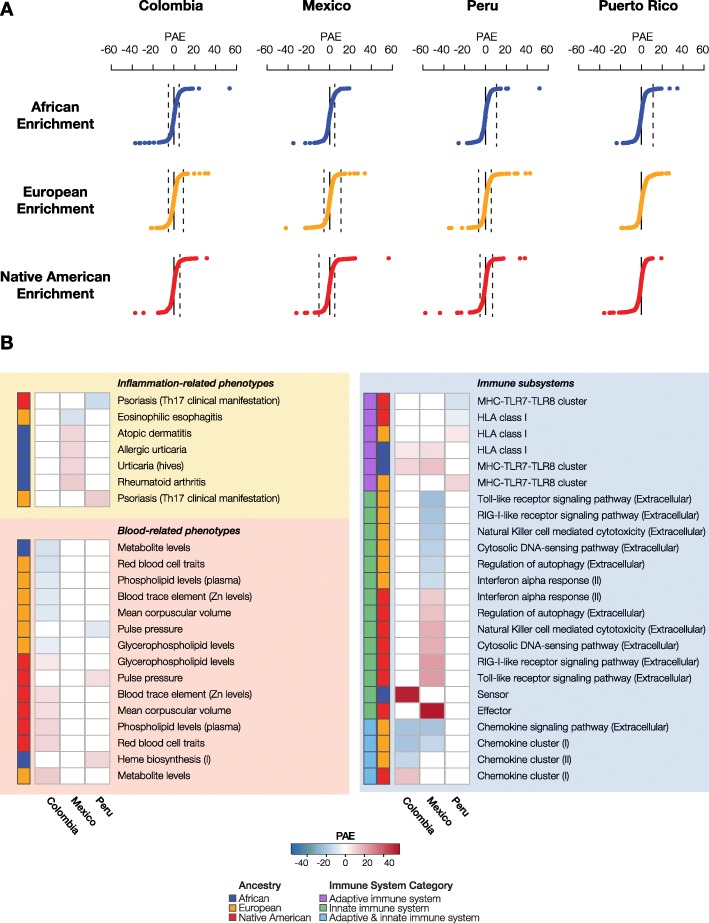
Fig. 5.
Polygenic ancestry enrichment (PAE) and admixture-enabled selection. a Distributions of the PAE test statistic are shown for each of the three ancestry components—African (blue), European (orange), and Native American (red)—across the four LA populations. Points beyond the dashed lines correspond to polygenic traits with statistically significant PAE values, after correction for multiple tests. b Polygenic traits that show evidence of PAE in multiple LA populations. PAE values are color coded as shown in the key, and the ancestry components are indicated for each trait. Immune system traits are divided into adaptive (purple), innate (green), or both (blue).

