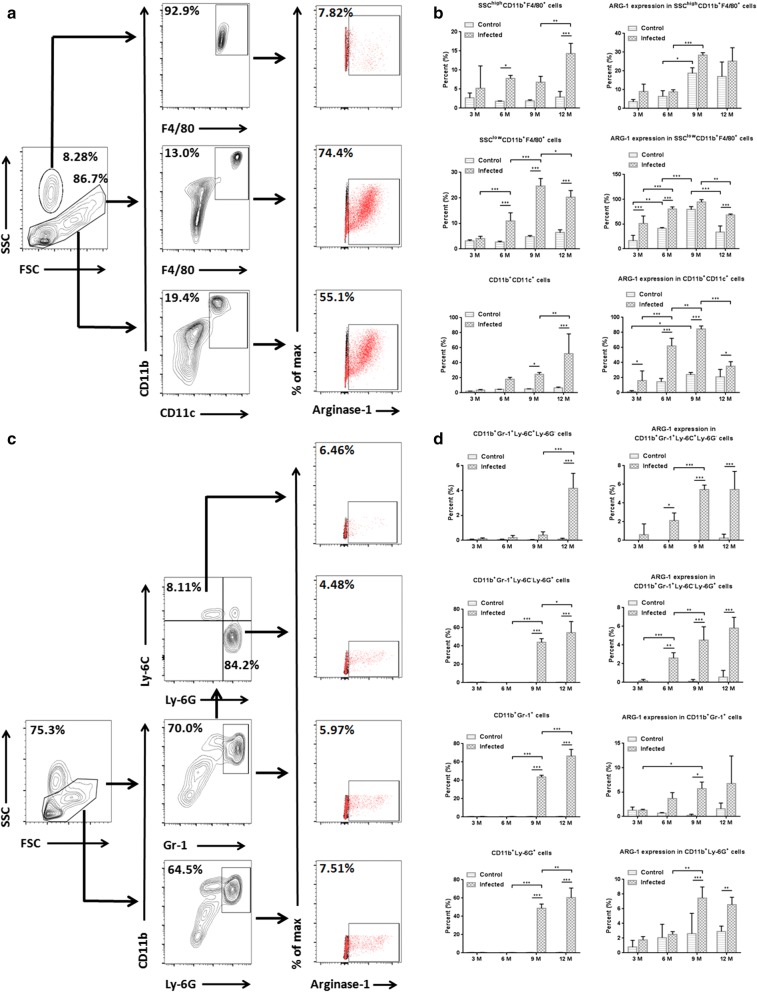
Fig. 2.
ARG-1 is produced in multiple peritoneal myeloid cells at different time points post-infection. a Representative flow cytometry analysis of ARG-1 expression in SSChighCD11b+F4/80+, SSClowCD11b+F4/80+ and CD11b+CD11c+ cells from one infected mouse at 6 months post-infection. b The percentages of SSChighCD11b+F4/80+ cells in total peritoneal leukocytes, SSClowCD11b+F4/80+ and CD11b+CD11c+ cells in SSC-low leukocytes, together with the percentages of ARG-1 expression in corresponding cells were determined by flow cytometry at 3, 6, 9 and 12 months post-infection. The differences were analyzed by a two-way ANOVA. c Representative flow cytometry analysis of ARG-1 expression in CD11b+Gr-1+Ly-6C+Ly-6G−, CD11b+Gr-1+Ly-6C−Ly-6G+, CD11b+Gr-1+ and CD11b+Ly-6G+ cells from one infected mouse at 12 months post-infection. d The percentages of CD11b+Gr-1+Ly-6C+Ly-6G−n, CD11b+Gr-1+Ly-6C−Ly-6G+, CD11b+Gr-1+ and CD11b+Ly-6G+ cells in SSC-low leukocytes, and the percentages of ARG-1 expression in the corresponding cells were determined by flow cytometry at 3, 6, 9 and 12 months post-infection. The differences were analyzed by a two-way ANOVA. The percentages of ARG-1 expression (red) were confirmed on the basis of isotypic controls (black) in a and c. The data are the result of one representative experiment out of three independent experiments. *P < 0.05, **P < 0.01, ***P < 0.001

